Fig. 12
Download original image
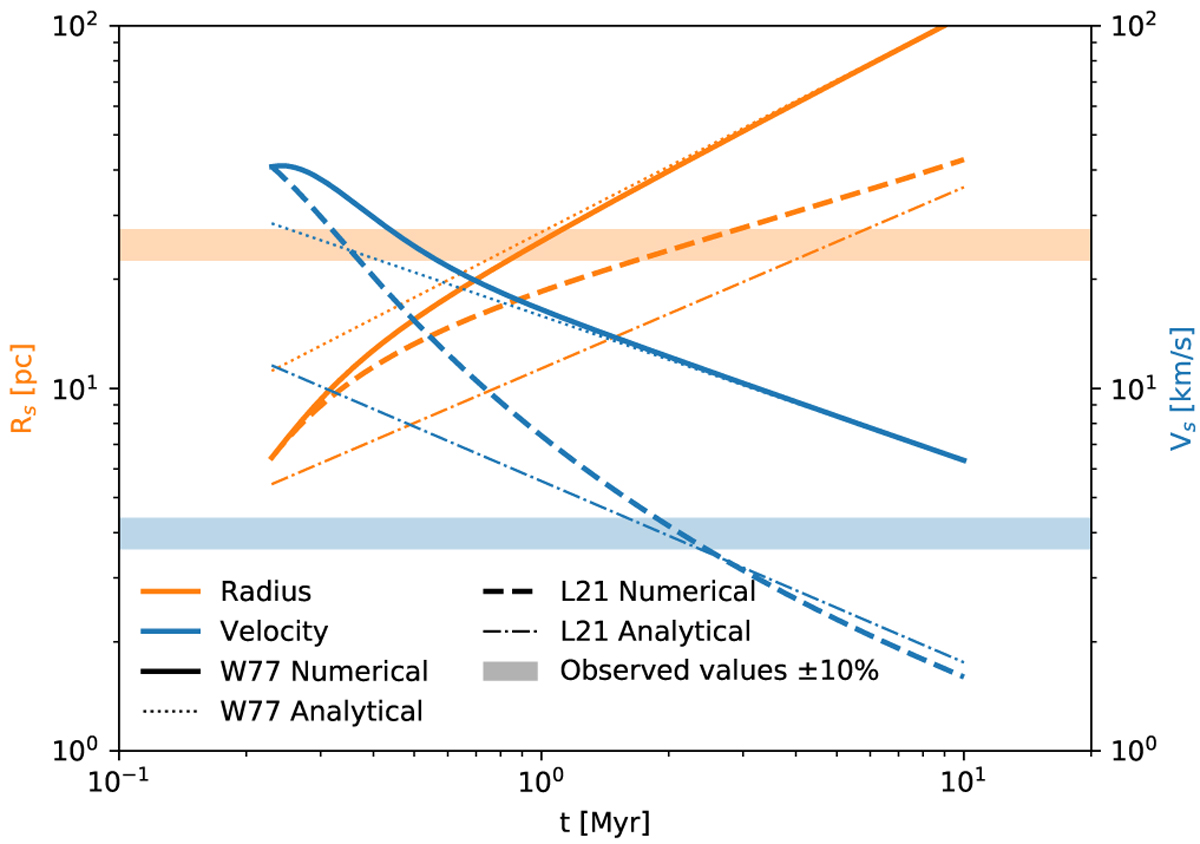
Evolution through time of the stellar wind bubble radius (orange) and velocity (blue) using the Weaver et al. (1977) (solid) and Lancaster et al. (2021a) (dashed) models, starting from the bubble’s radius and velocity at 0.23 Myr (with a corresponding density at the shell of l6.0 amu cm−3). The efficiency α parameters in the Lancaster model have both been set to 1. The dotted and dash-dotted lines denote the analytical Weaver and Lancaster solutions, respectively. The shaded regions show 25 pc and 4 km s−1, with 10% errors.
Current usage metrics show cumulative count of Article Views (full-text article views including HTML views, PDF and ePub downloads, according to the available data) and Abstracts Views on Vision4Press platform.
Data correspond to usage on the plateform after 2015. The current usage metrics is available 48-96 hours after online publication and is updated daily on week days.
Initial download of the metrics may take a while.