Fig. 11
Download original image
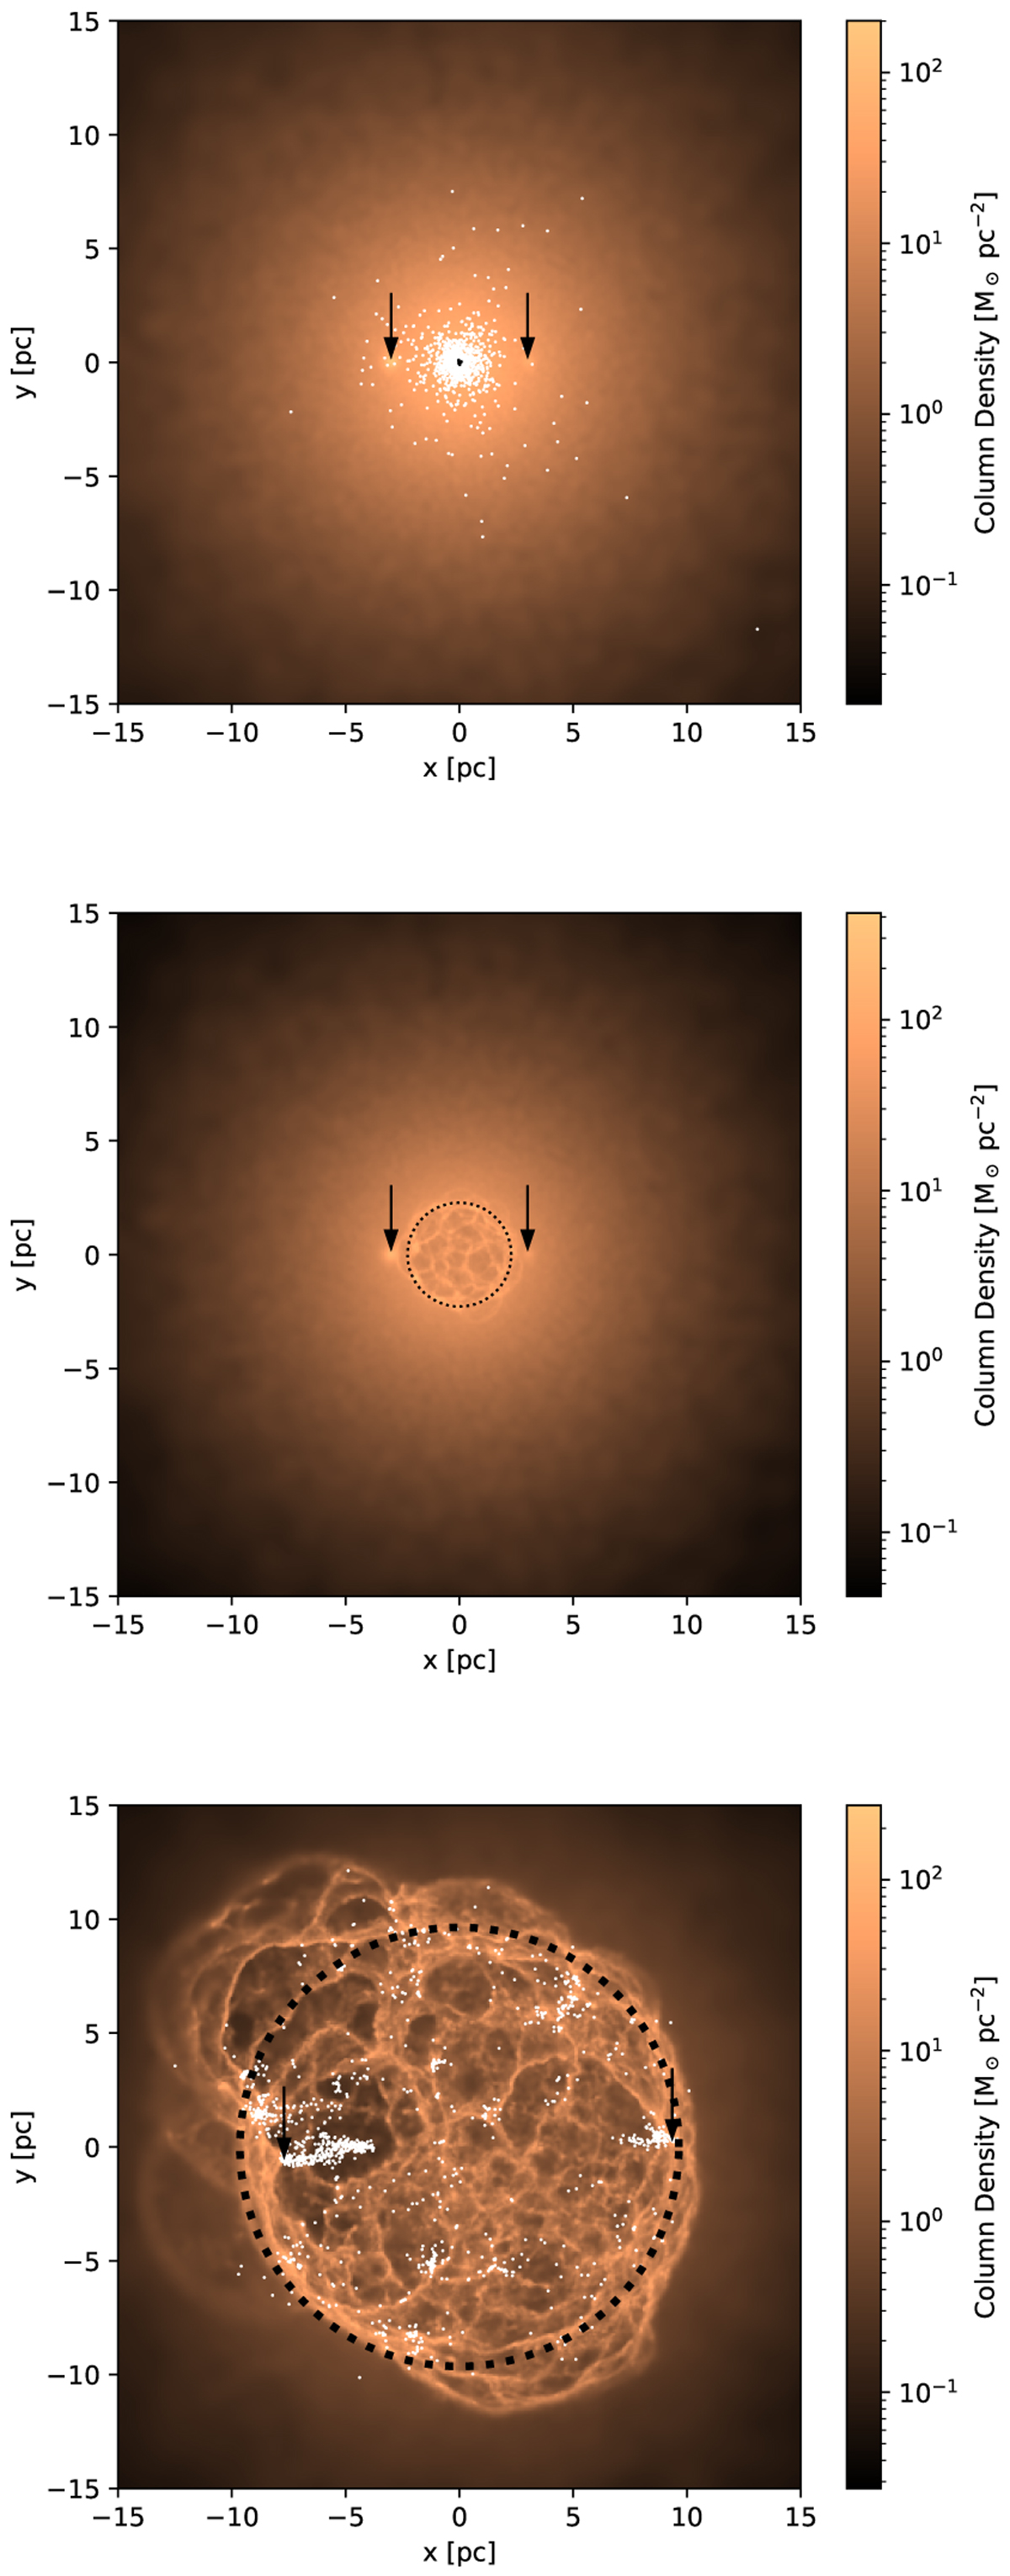
Gas column density maps of the numerical simulation at 0.01 Myr (top), 0.12 Myr (centre), and 0.30 Myr (bottom). The top panel also shows the projected positions of the stars more massive than 16 M⊙ (black points) and those less massive than 16 M⊙ (white points). The bottom panel shows the projected positions of the sink particles as white points. The arrows point out the 50 M⊙ (left) and 10 M⊙ (right) cloudlets. The centre and bottom panels show the position of the shell as a black dotted circle.
Current usage metrics show cumulative count of Article Views (full-text article views including HTML views, PDF and ePub downloads, according to the available data) and Abstracts Views on Vision4Press platform.
Data correspond to usage on the plateform after 2015. The current usage metrics is available 48-96 hours after online publication and is updated daily on week days.
Initial download of the metrics may take a while.