Fig. 10
Download original image
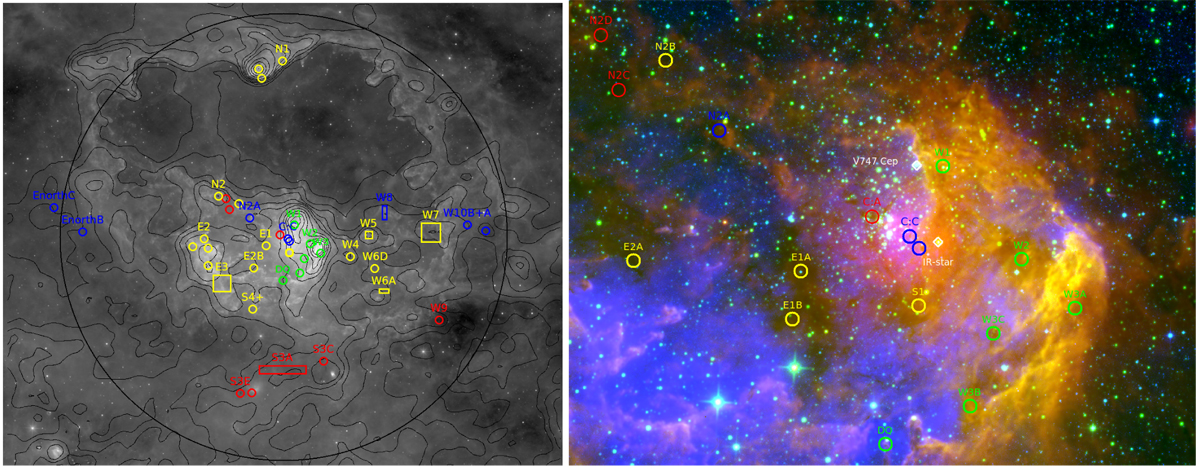
Map of cloudlets. Left: overview of the region shown in Fig. 1 in 12 µm from WISE (grey scale) with the Planck 857 GHz map (black contours) overlaid to emphasise the dust emission. A black circle spanning a radius of 1.6° is centred on the Berkeley 59 cluster. The blue dots from Fig. 9 are shown as blue circles and mark the locations where the high negative expansion velocities are found. Likewise, the green circles refer to the intermediate and the yellow the low negative velocity components, while the red circles mark positions where the positive component is found, possibly related to the expansion on the far side. Right: close-up 55′× 40′ view of the central region where the red, green, blue coding is WISE 12 µm (red), 4.6 µm (green), and Digitized Sky Survey 2 red plates (blue). The positions of V747 Cep and the IR star are marked with white diamonds.
Current usage metrics show cumulative count of Article Views (full-text article views including HTML views, PDF and ePub downloads, according to the available data) and Abstracts Views on Vision4Press platform.
Data correspond to usage on the plateform after 2015. The current usage metrics is available 48-96 hours after online publication and is updated daily on week days.
Initial download of the metrics may take a while.