Fig. 8
Download original image
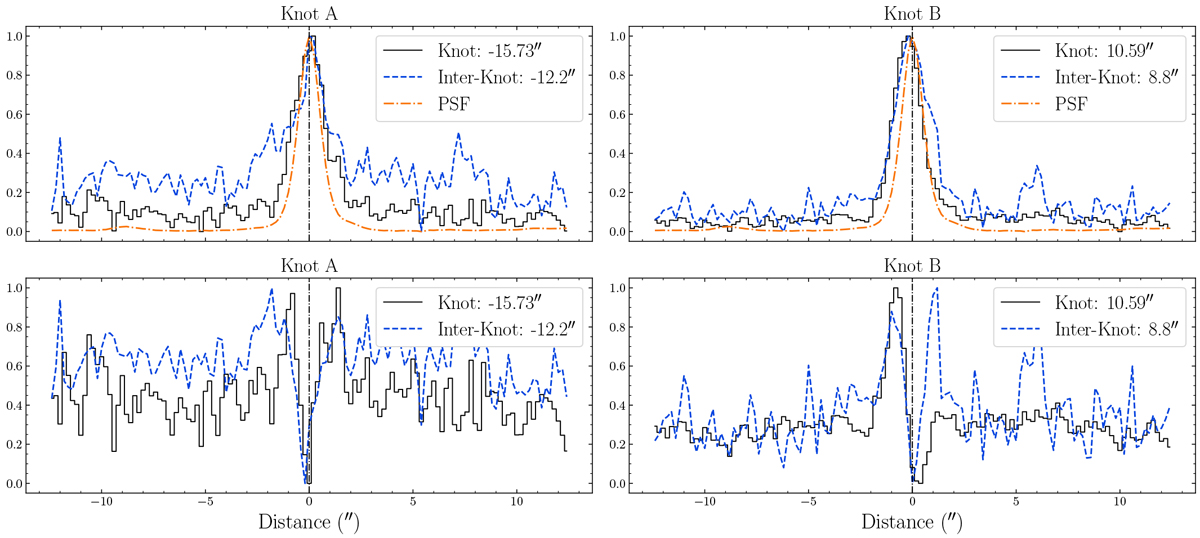
Spatial profiles (top) and PSF-subtracted spatial profile residuals (bottom) for the [S II]λ6731 line. Transverse cuts each with a width of 1″ (5 pixels) are taken across the PSF and knot/inter-knot regions specified on the plots and the profiles normalised before subtraction. We take the centre (in arcseconds) to be the location of the peak of the PSF, as we are concerned primarily with the relative shifts in knot centroid positions. Note the differences in the knots B and C compared to A and A3, suggesting that the red-shifted jet is less symmetric than its blue-shifted counterpart.
Current usage metrics show cumulative count of Article Views (full-text article views including HTML views, PDF and ePub downloads, according to the available data) and Abstracts Views on Vision4Press platform.
Data correspond to usage on the plateform after 2015. The current usage metrics is available 48-96 hours after online publication and is updated daily on week days.
Initial download of the metrics may take a while.