Free Access
Fig. 6
Download original image
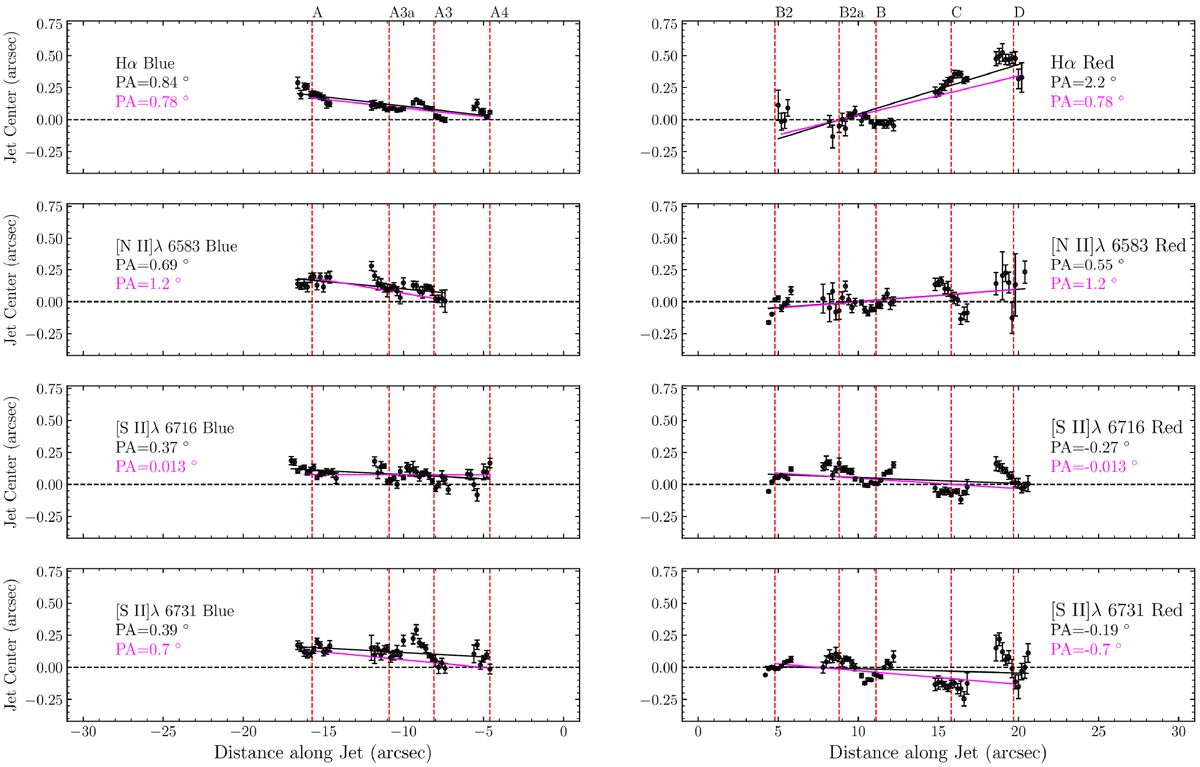
Gaussian centroids fitted along the jet axis for the aforementioned emission lines. As with Fig. 5, the magenta lines correspond to the fit of the knot peak positions, while the black lines correspond to a fit to all the data points.
Current usage metrics show cumulative count of Article Views (full-text article views including HTML views, PDF and ePub downloads, according to the available data) and Abstracts Views on Vision4Press platform.
Data correspond to usage on the plateform after 2015. The current usage metrics is available 48-96 hours after online publication and is updated daily on week days.
Initial download of the metrics may take a while.