Fig. 4
Download original image
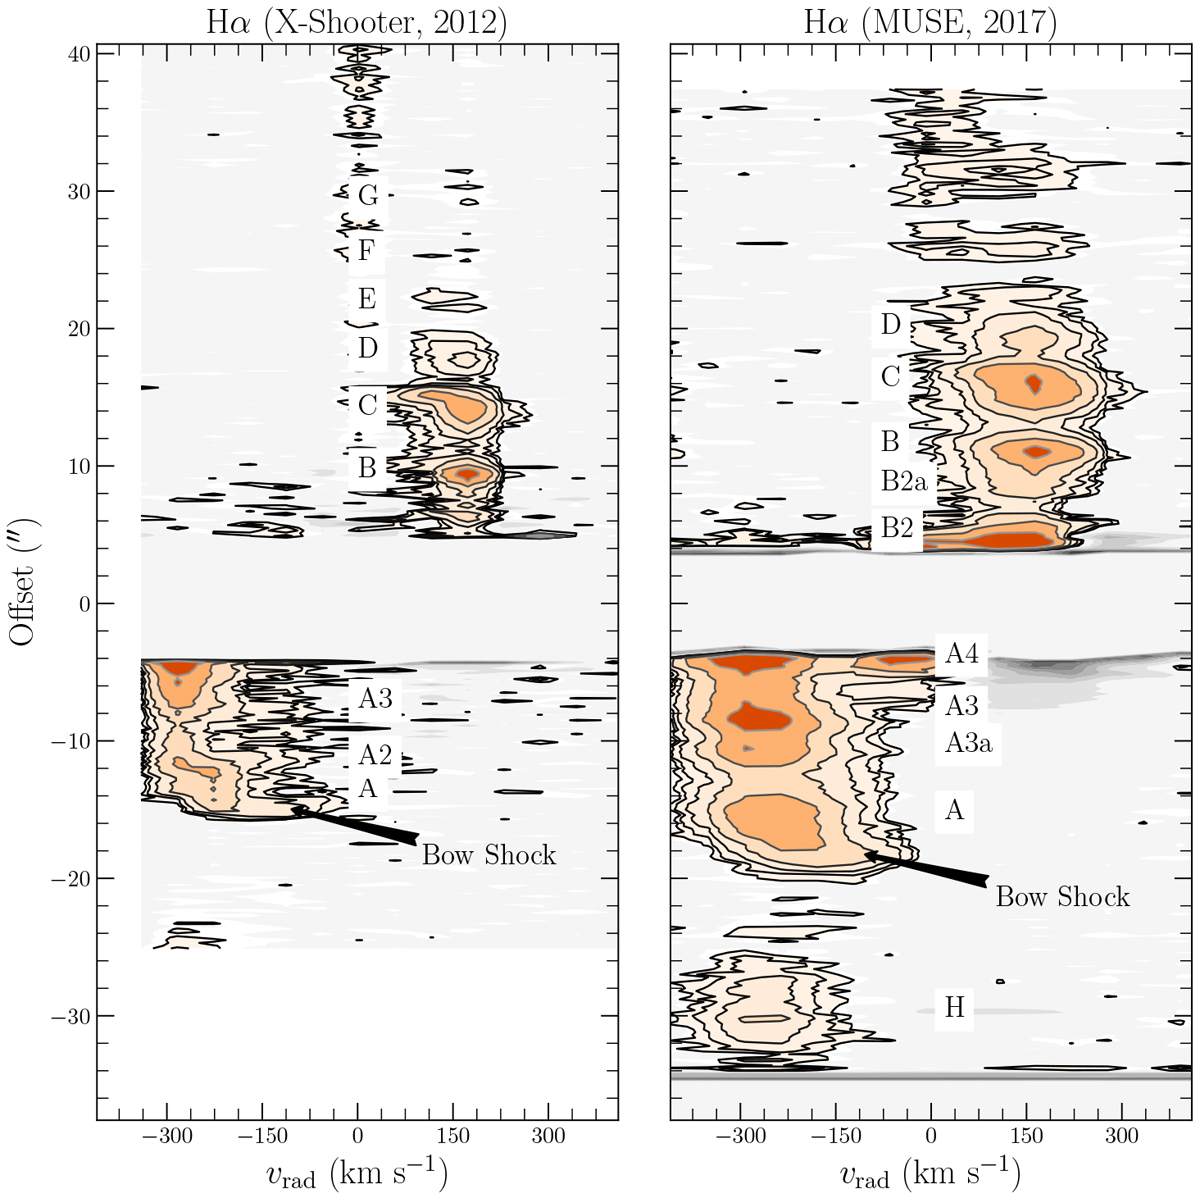
A comparison of the PV arrays from X-shooter (left) and MUSE (right) for the Hα line. The X-shooter spectra have been degraded to match the resolution of MUSE. The contours are on a log scale corresponding to log Fλ = [−17.4, −17.2, −16.9, −16.6, −16.4, −16.0, −15.7] for the X-shooter data and log Fλ = [−18.8, −18.6, −18.3, −18.0, −17.7, −17.4, −17.0] for the MUSE data.
Current usage metrics show cumulative count of Article Views (full-text article views including HTML views, PDF and ePub downloads, according to the available data) and Abstracts Views on Vision4Press platform.
Data correspond to usage on the plateform after 2015. The current usage metrics is available 48-96 hours after online publication and is updated daily on week days.
Initial download of the metrics may take a while.