Fig. 2
Download original image
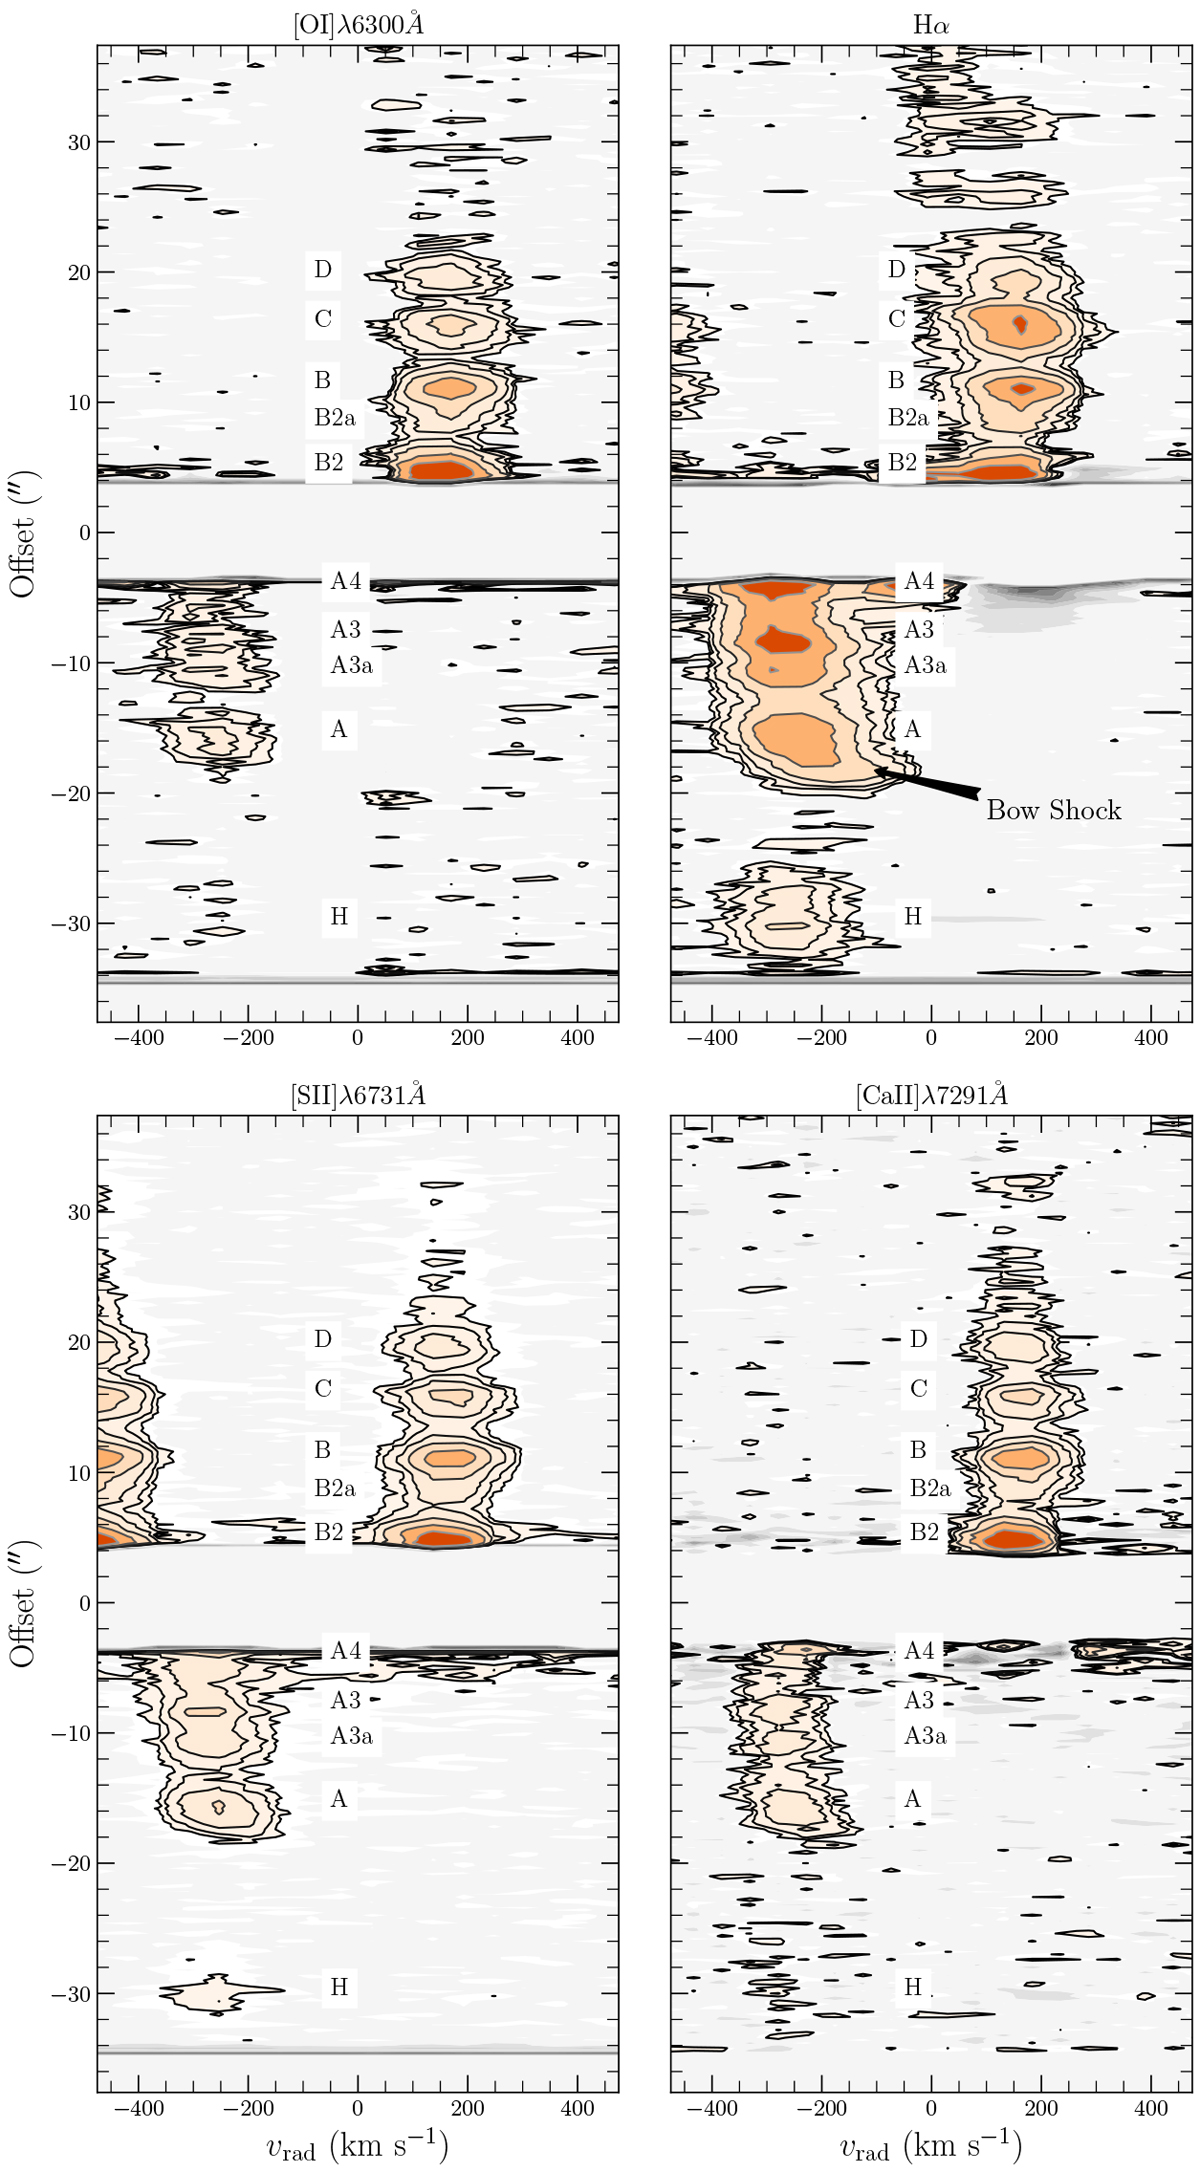
Position-velocity diagrams of the [O I]λ6300 (top left), Hα (top right), [S II]λ6731 (bottom left), and [Ca II]λ7291 (bottom right) emissions of the HD 163296 outflow, corrected for the local standard of rest. The colour contours represent a 3σ detection, and the background contours are on a log scale up to 2σ. The bow shock in knot A is visible in Hα, [S II]λ6731, and [Ca II]λ7291 (see Table 1). The emission at the far edge of the [S II]λ6731 line is the red-shifted lobe of the [S II]λ6716 line.
Current usage metrics show cumulative count of Article Views (full-text article views including HTML views, PDF and ePub downloads, according to the available data) and Abstracts Views on Vision4Press platform.
Data correspond to usage on the plateform after 2015. The current usage metrics is available 48-96 hours after online publication and is updated daily on week days.
Initial download of the metrics may take a while.