Open Access
Fig. 6.
Download original image
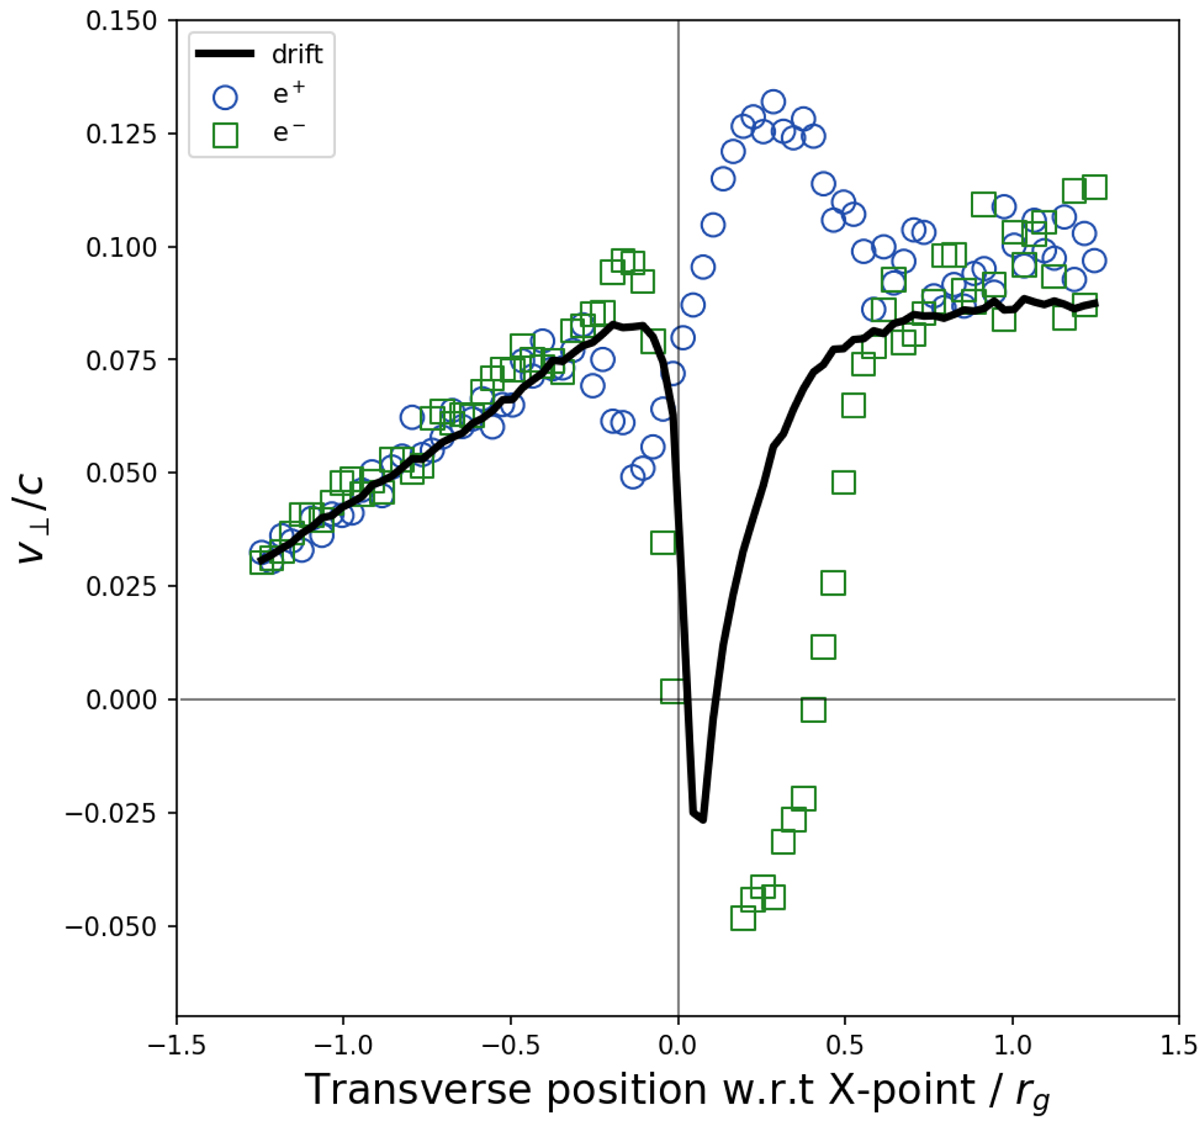
Profiles along a line transverse to the current sheet and passing through an X point. The components of the drift velocity (solid black line) and of the positron and electron velocities (respectively blue circles and green squares) normal to the current sheet are represented.
Current usage metrics show cumulative count of Article Views (full-text article views including HTML views, PDF and ePub downloads, according to the available data) and Abstracts Views on Vision4Press platform.
Data correspond to usage on the plateform after 2015. The current usage metrics is available 48-96 hours after online publication and is updated daily on week days.
Initial download of the metrics may take a while.