Fig. 3.
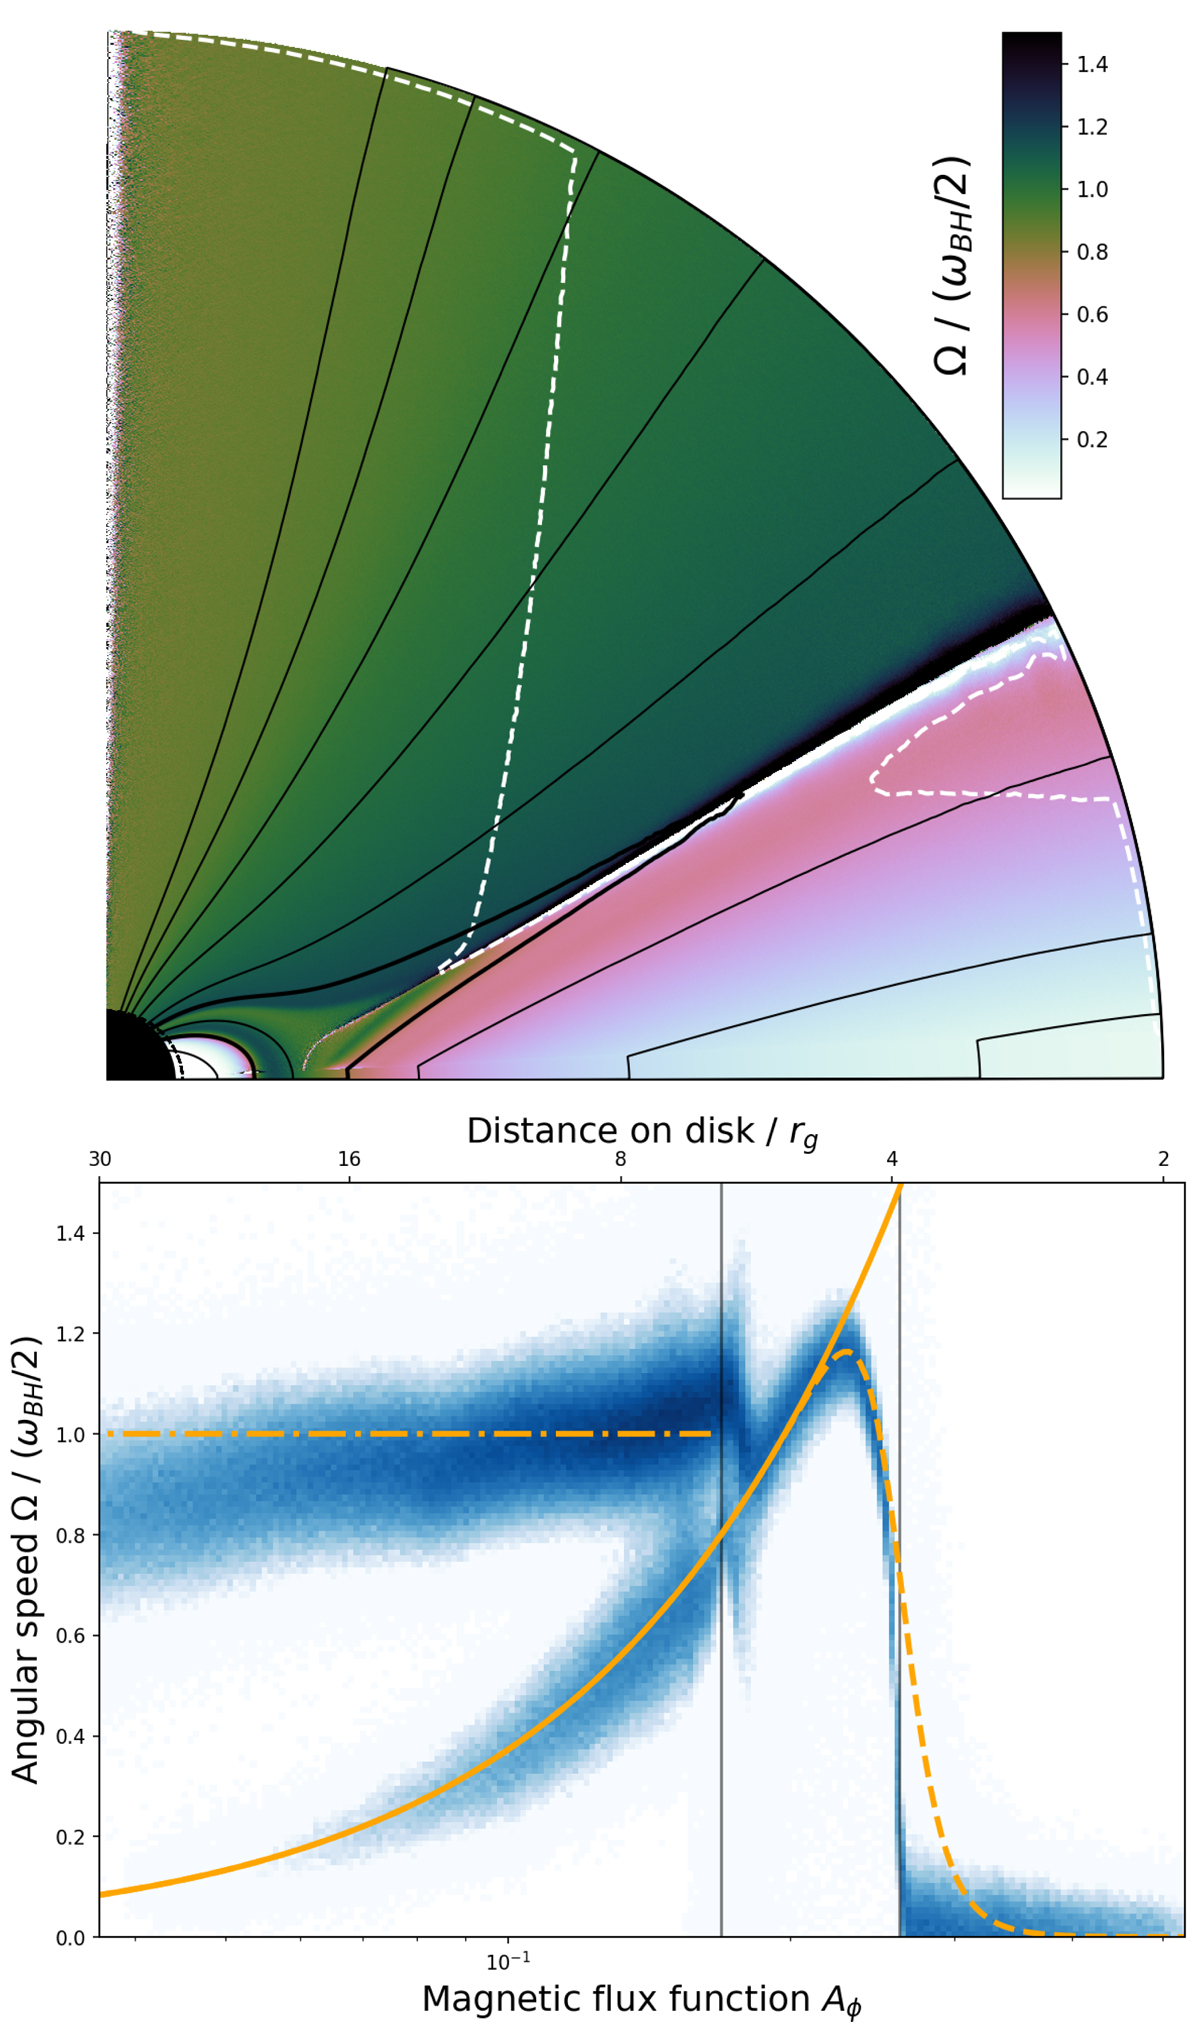
Download original image
Angular speed of the magnetic field lines. Top panel: color map of the time-averaged angular speed, Ω, with poloidal magnetic field lines overlaid, for a simulation with a = 0.6 and ϵ = 5%. The dashed white line is the outer light surface. Bottom panel: angular speed of magnetic field lines as a function of their magnetic flux function, Aϕ, with the corresponding distance of the line footpoint on the disk at the top. The color map is the histogram of the (Aϕ, Ω) pairs measured in each cell of the simulation space at a fiducial time. The left (respectively right) vertical line stands for the separatrix footpoint (respectively the ISCO). In orange are the Keplerian profiles (Eq. (2)) without (solid) and with (dashed) the smooth cutoff, and half of the BH angular speed (dash-dotted).
Current usage metrics show cumulative count of Article Views (full-text article views including HTML views, PDF and ePub downloads, according to the available data) and Abstracts Views on Vision4Press platform.
Data correspond to usage on the plateform after 2015. The current usage metrics is available 48-96 hours after online publication and is updated daily on week days.
Initial download of the metrics may take a while.