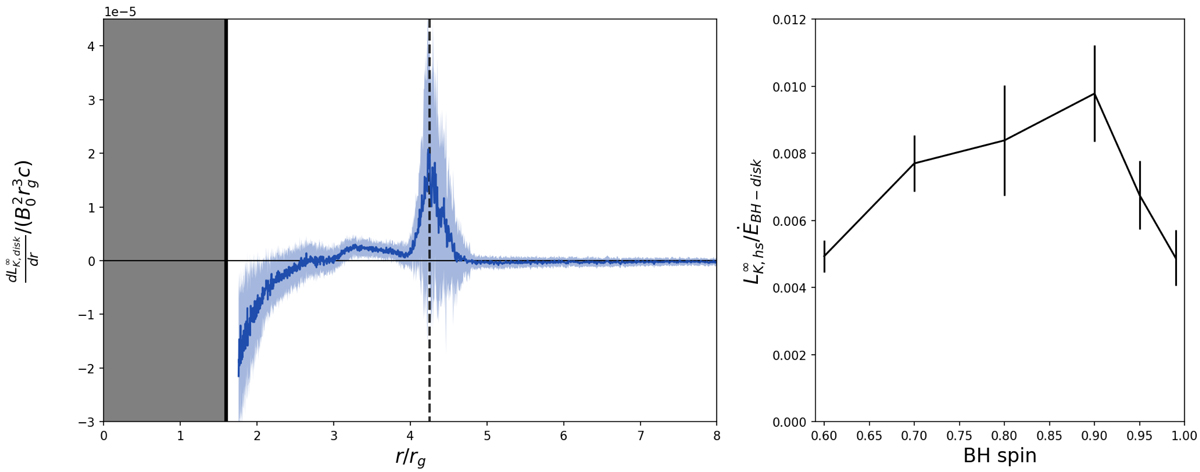
Fig. 15.

Download original image
Deposit of particle kinetic energy on the disk. Left panel: flux on the disk of particle kinetic energy per unit time per ring of infinitesimal width, dr, as a function of the distance, r, to the BH, for a = 0.8. The solid blue curve is the median profile, and the light blue shaded region is the 1σ variability. Vertical lines are the event horizon (solid) and the separatrix footpoint (dashed). Right panel: flux of particle kinetic energy per unit time near the separatrix footpoint compared to the rate of energy deposited onto the disk, ĖBH−disk, per unit time via the coupling magnetic field lines.
Current usage metrics show cumulative count of Article Views (full-text article views including HTML views, PDF and ePub downloads, according to the available data) and Abstracts Views on Vision4Press platform.
Data correspond to usage on the plateform after 2015. The current usage metrics is available 48-96 hours after online publication and is updated daily on week days.
Initial download of the metrics may take a while.


