Fig. 10.
Download original image
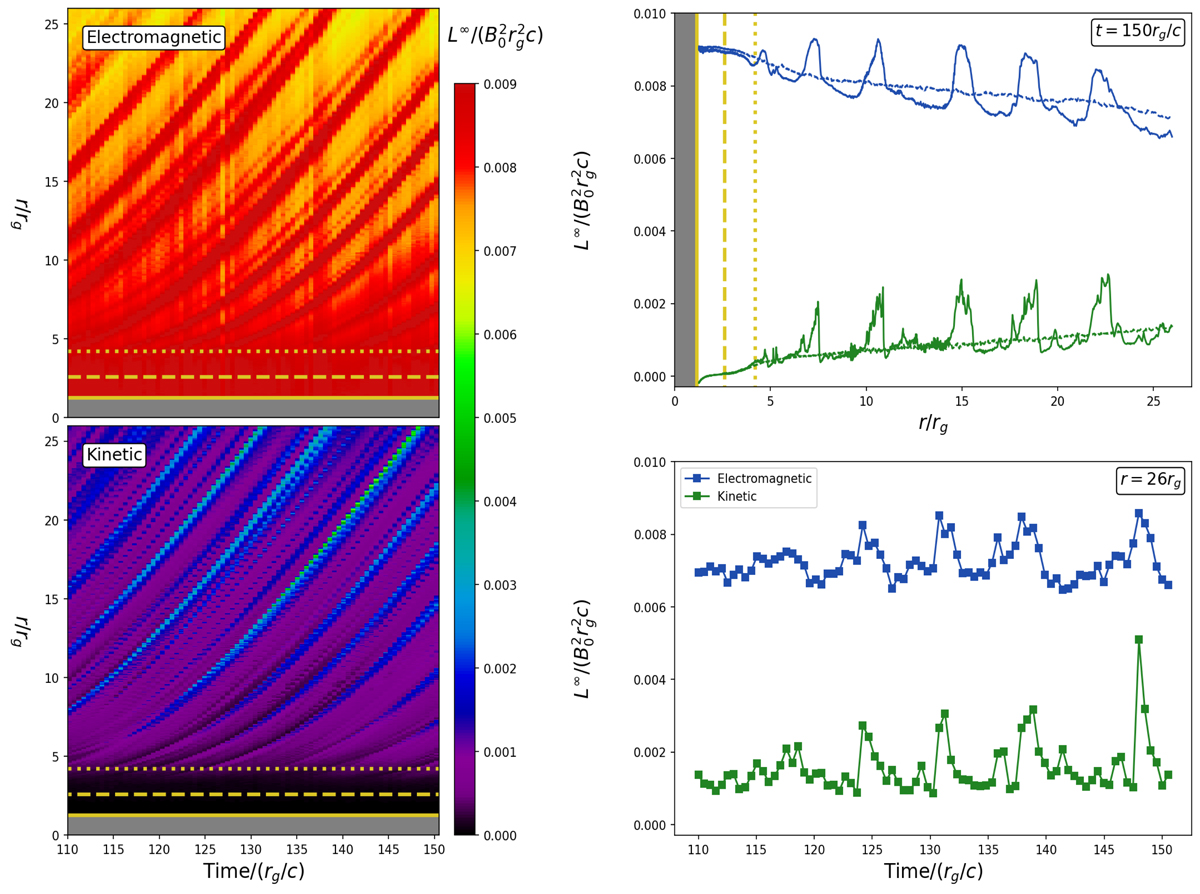
Dissipation of electromagnetic energy and particle acceleration. Left column: electromagnetic (top panel) and particle kinetic (bottom panel) energy flux through a surface extending up to a radius r (left axis) as a function of time and for a thin disk with a BH spin a = 0.99. Right column: slices at constant time t = 150 rg/c (top panel) and constant radius r = 26 rg (bottom panel) of the fluxes. The dashed lines in the upper panel are the time-averaged profiles. The solid, dashed, and dotted yellow lines show the event horizon, the distance to the separatrix footpoint, and the distance to the Y point, respectively.
Current usage metrics show cumulative count of Article Views (full-text article views including HTML views, PDF and ePub downloads, according to the available data) and Abstracts Views on Vision4Press platform.
Data correspond to usage on the plateform after 2015. The current usage metrics is available 48-96 hours after online publication and is updated daily on week days.
Initial download of the metrics may take a while.