Open Access
Fig. B.2
Download original image
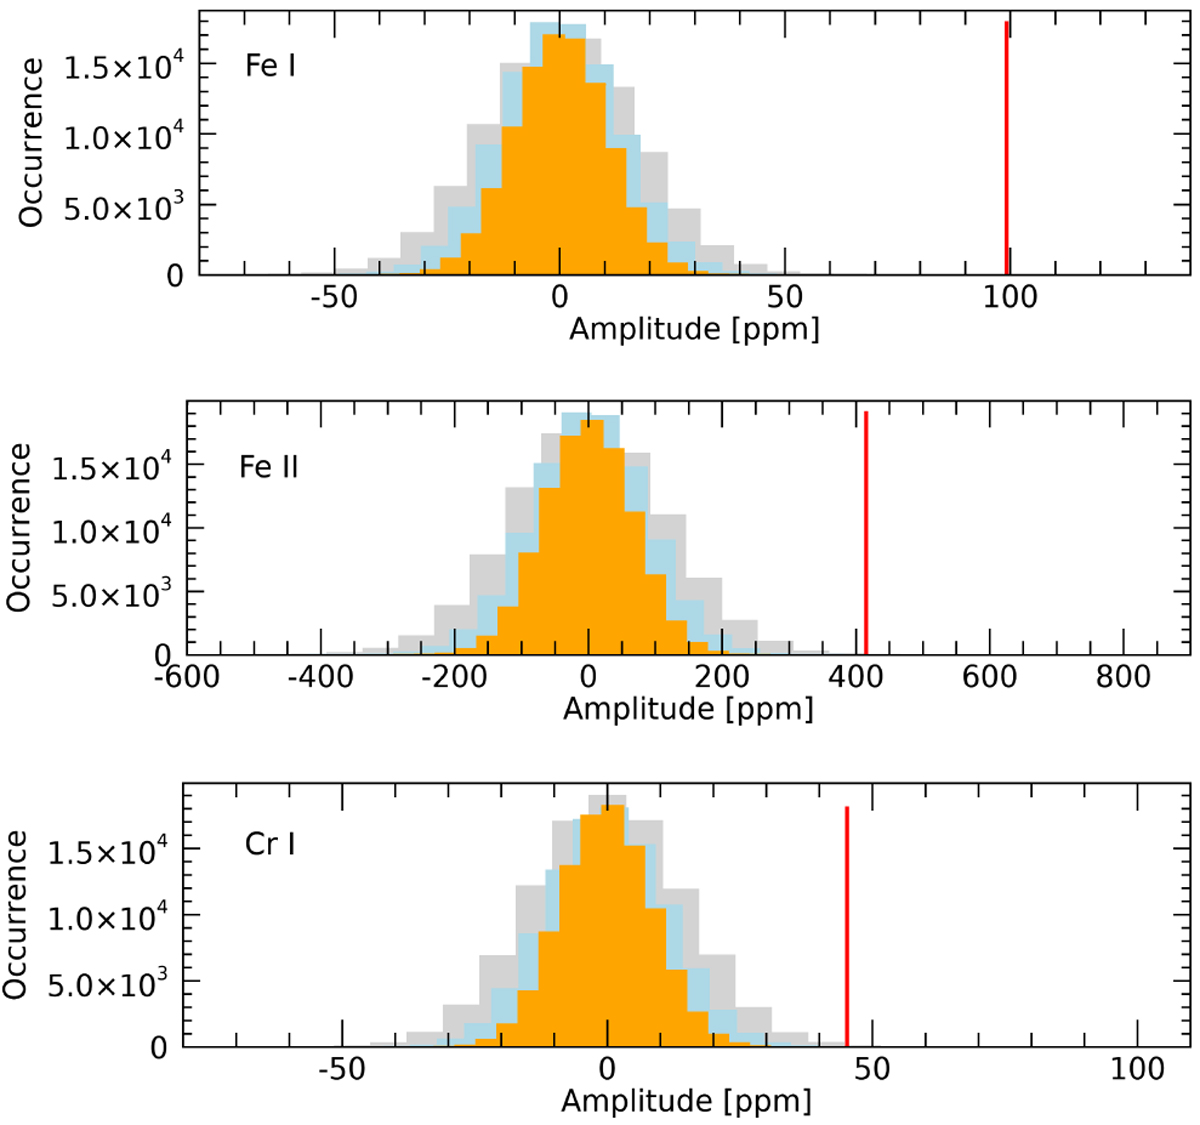
Distributions created with the bootstrap method for Fe I, Fe II, and Cr I, respectively. The grey, light blue, and orange distributions come from fixed widths of 5, 10, and 20 km s−1, respectively. The vertical red lines show the amplitude of the detection.
Current usage metrics show cumulative count of Article Views (full-text article views including HTML views, PDF and ePub downloads, according to the available data) and Abstracts Views on Vision4Press platform.
Data correspond to usage on the plateform after 2015. The current usage metrics is available 48-96 hours after online publication and is updated daily on week days.
Initial download of the metrics may take a while.