Open Access
Fig. B.1
Download original image
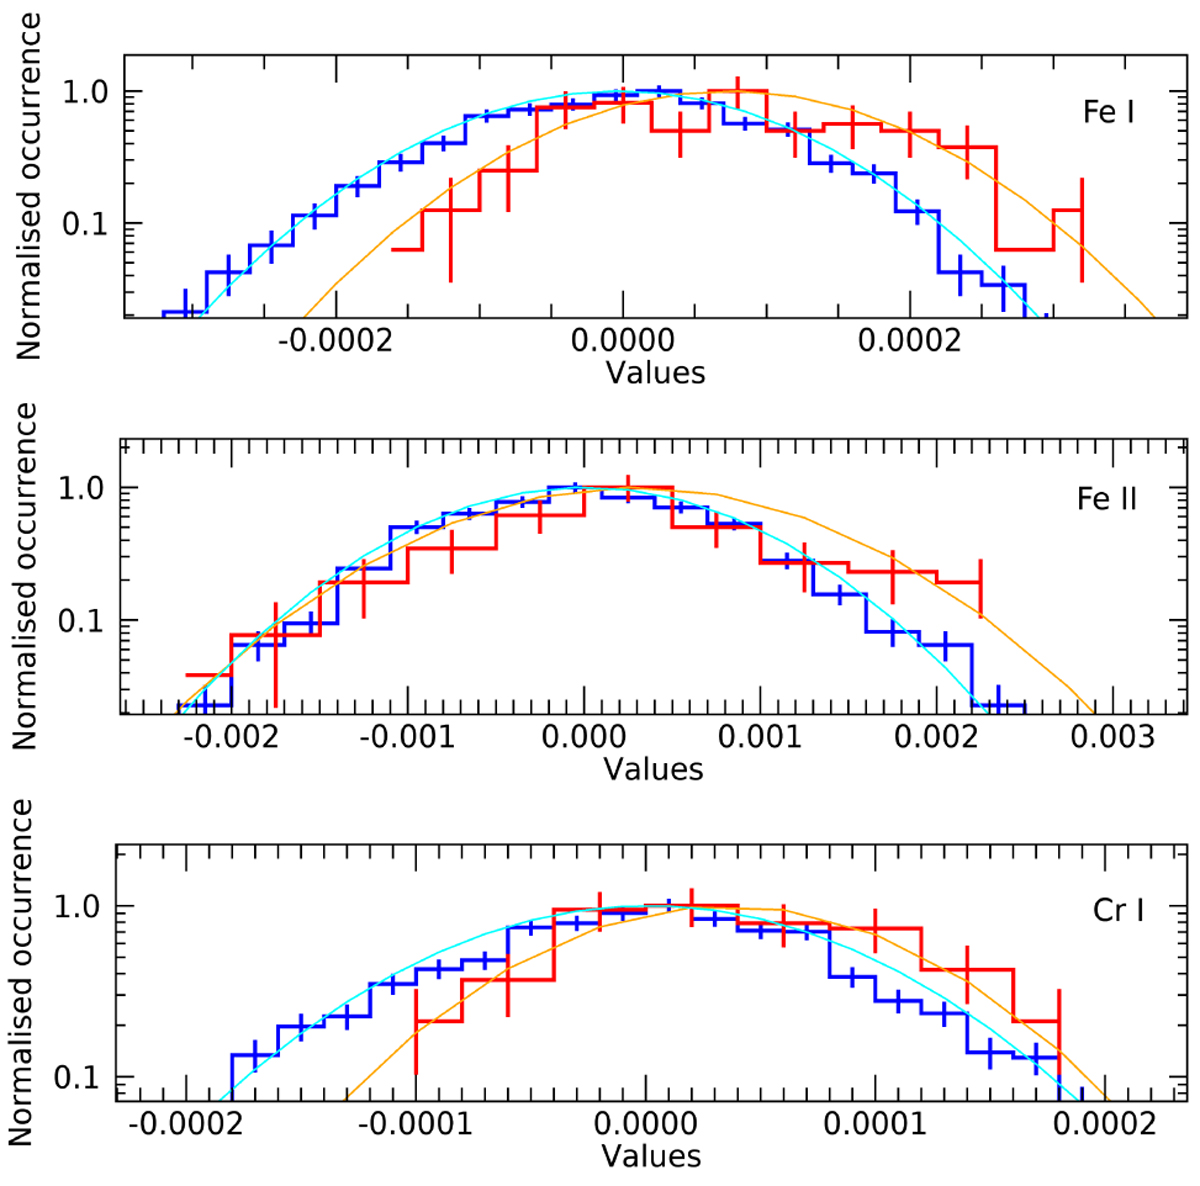
Distribution of the night 1 in-trail and out-of-trail samples for Fei, Fe II, and Cr I, respectively. The blue histogram represents the out-of-trail distribution, while the red histogram is the in-trail one. The respective Gaussian distributions are shown as cyan and orange lines.
Current usage metrics show cumulative count of Article Views (full-text article views including HTML views, PDF and ePub downloads, according to the available data) and Abstracts Views on Vision4Press platform.
Data correspond to usage on the plateform after 2015. The current usage metrics is available 48-96 hours after online publication and is updated daily on week days.
Initial download of the metrics may take a while.