Fig. 1
Download original image
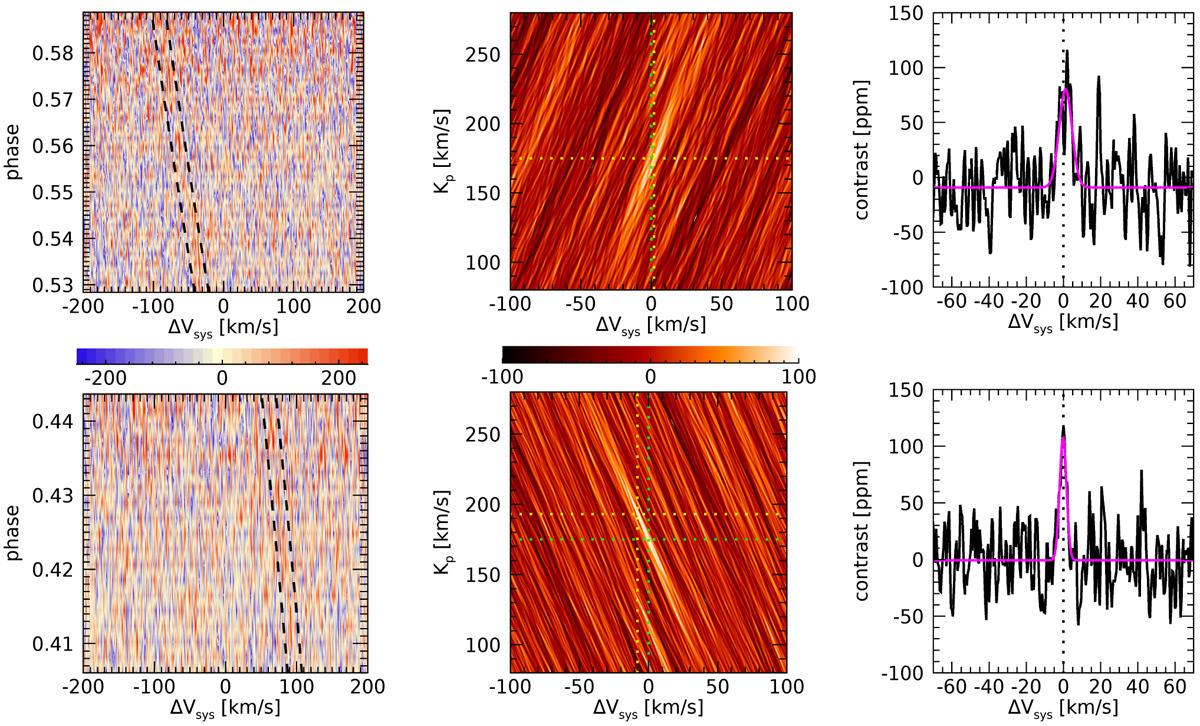
CCF signal of KELT-20b. The first row refers to night 1 and the second row to night 2. Left panels: 2D tomography of the CCF residuals maps. The dashed lines bracket the expected planetary signal position. Central panels: Kp-∆Vsys maps. The green dotted lines mark the theoretical planetary position. Right panels: planetary emission signal averaged at the theoretical Kp. The magenta line represents the Gaussian fit to the data.
Current usage metrics show cumulative count of Article Views (full-text article views including HTML views, PDF and ePub downloads, according to the available data) and Abstracts Views on Vision4Press platform.
Data correspond to usage on the plateform after 2015. The current usage metrics is available 48-96 hours after online publication and is updated daily on week days.
Initial download of the metrics may take a while.