Fig. 1
Download original image
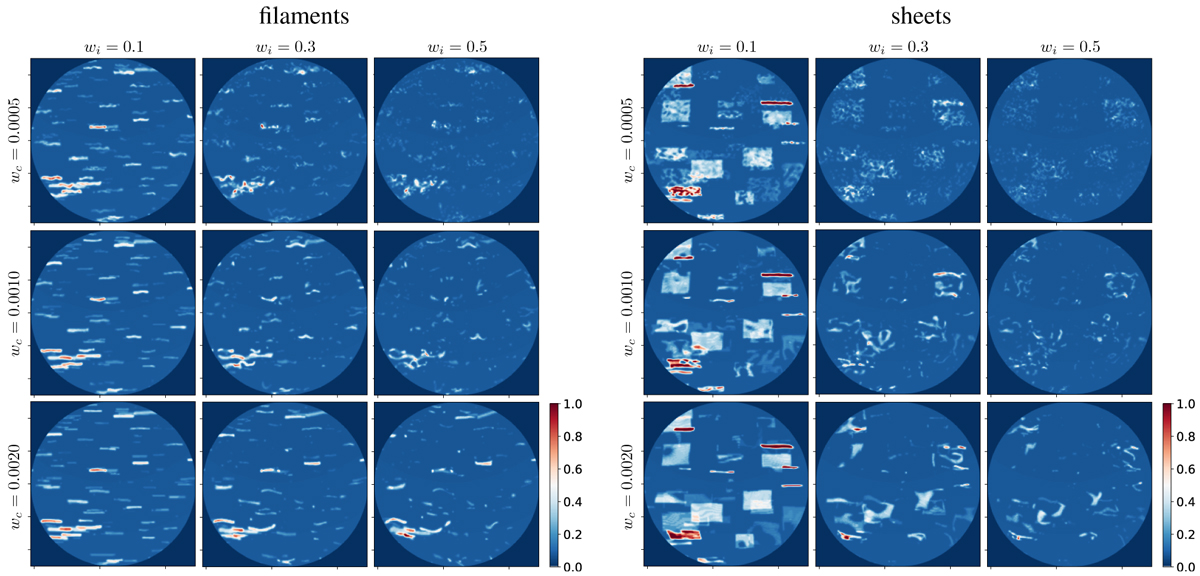
Column density (K) maps obtained for filament-like (left) and sheet-like (right) density structures with different wiggle parameters. The wiggle intensity (wi) is constant in columns and increases from left to right, and the wiggle correlation length (wc) is constant in rows and increases from top to bottom. In our settings, wi and wc have units of [pc/(100 × 200)]. The shape parameters of filaments and sheets are the same in each panel and read as follows (in pc): Filaments: L ϵ [7, 25] and R ϵ [1.5, 4.5], and sheets: L ϵ [5, 20], R12 ϵ [10, 20] and R13 ϵ [1, 3] (see Sect. 2.1.4 and Table 1 for the parameter definitions and labels.) The circular regions displayed on these maps have an angular radius of 12.53°. All maps share the same color scale, which is expressed in 1021 cm–2.
Current usage metrics show cumulative count of Article Views (full-text article views including HTML views, PDF and ePub downloads, according to the available data) and Abstracts Views on Vision4Press platform.
Data correspond to usage on the plateform after 2015. The current usage metrics is available 48-96 hours after online publication and is updated daily on week days.
Initial download of the metrics may take a while.