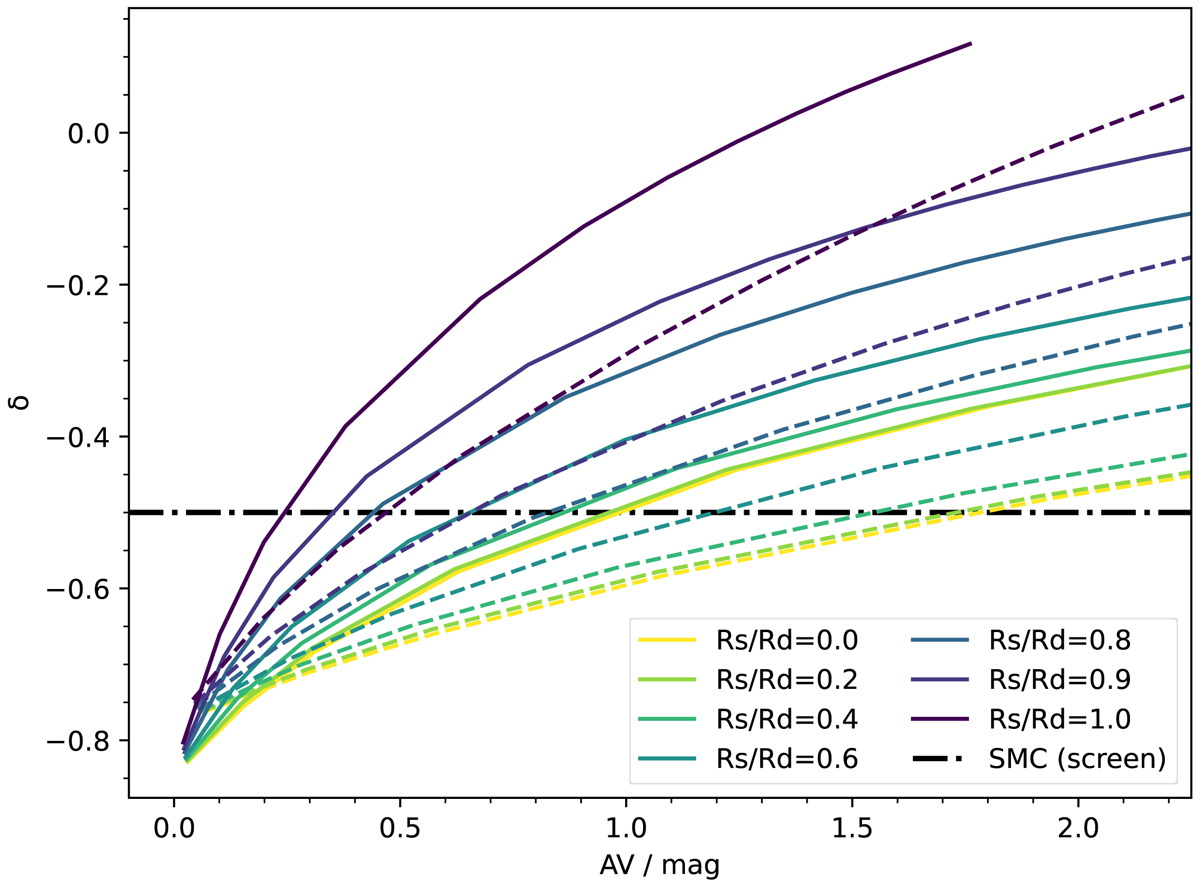
Fig. 9.
Download original image
Index δ of the power law modifying the starburst attenuation curve versus the V band attenuation for the clumpy ISM models of Seon & Draine (2016) with a Mach number of 4. Each colored line represents a model with a varying V-band optical depth and for a fixed distribution of stars and dust, parametrized by the ratio of their radii (Rs/Rd, for additional detail see Seon & Draine 2016). The solid lines represent a dust composition following the SMC dust model of Weingartner & Draine (2001) and the dashed lines that of Witt & Gordon (2000). The dash-dotted horizontal line indicates the slope of an SMC curve in the case of a pure screen geometry. We see that at fixed attenuation, the more extended the stellar distribution is compared to the dust, the flatter the attenuation curve is.
Current usage metrics show cumulative count of Article Views (full-text article views including HTML views, PDF and ePub downloads, according to the available data) and Abstracts Views on Vision4Press platform.
Data correspond to usage on the plateform after 2015. The current usage metrics is available 48-96 hours after online publication and is updated daily on week days.
Initial download of the metrics may take a while.