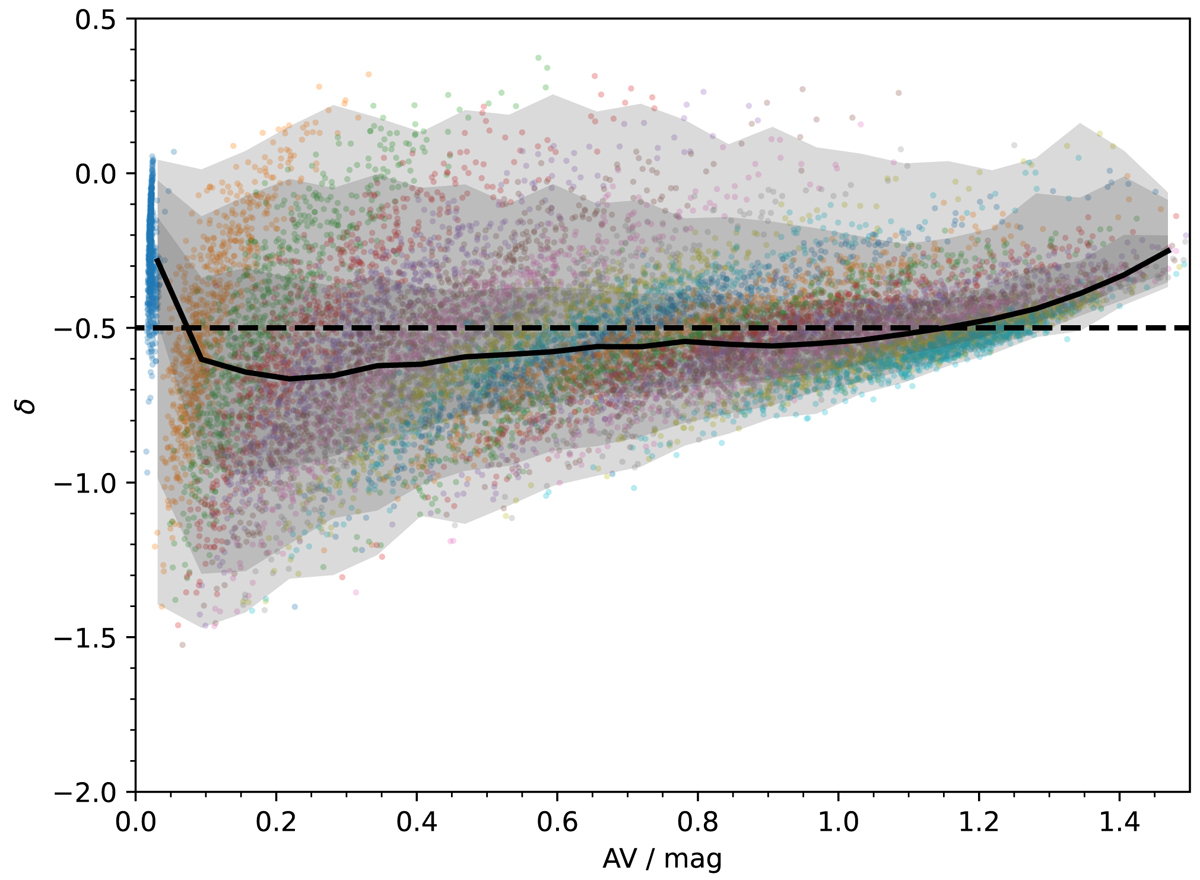
Fig. 8.
Download original image
Estimation of δ versus the V-band attenuation for a set of synthetic galaxies with fixed δ = −0.5 (dashed black horizontal line) and a variable attenuation. Each value of the true reddening is plotted in a different color. The shaded areas represent the 1-, 2-, and 3-σ dispersion on δ, with the solid line indicating the median. The effect of the degeneracy is clearly visible for galaxies of the same true reddening. However, considering a range of attenuations, its effect is little different from a dispersion on δ with only a weak trend towards lower δ at low AV. In addition, very few objects have an extremely steep δ, making it unlikely that they are generated due to degeneracies that would smear the results for a single attenuation curve.
Current usage metrics show cumulative count of Article Views (full-text article views including HTML views, PDF and ePub downloads, according to the available data) and Abstracts Views on Vision4Press platform.
Data correspond to usage on the plateform after 2015. The current usage metrics is available 48-96 hours after online publication and is updated daily on week days.
Initial download of the metrics may take a while.