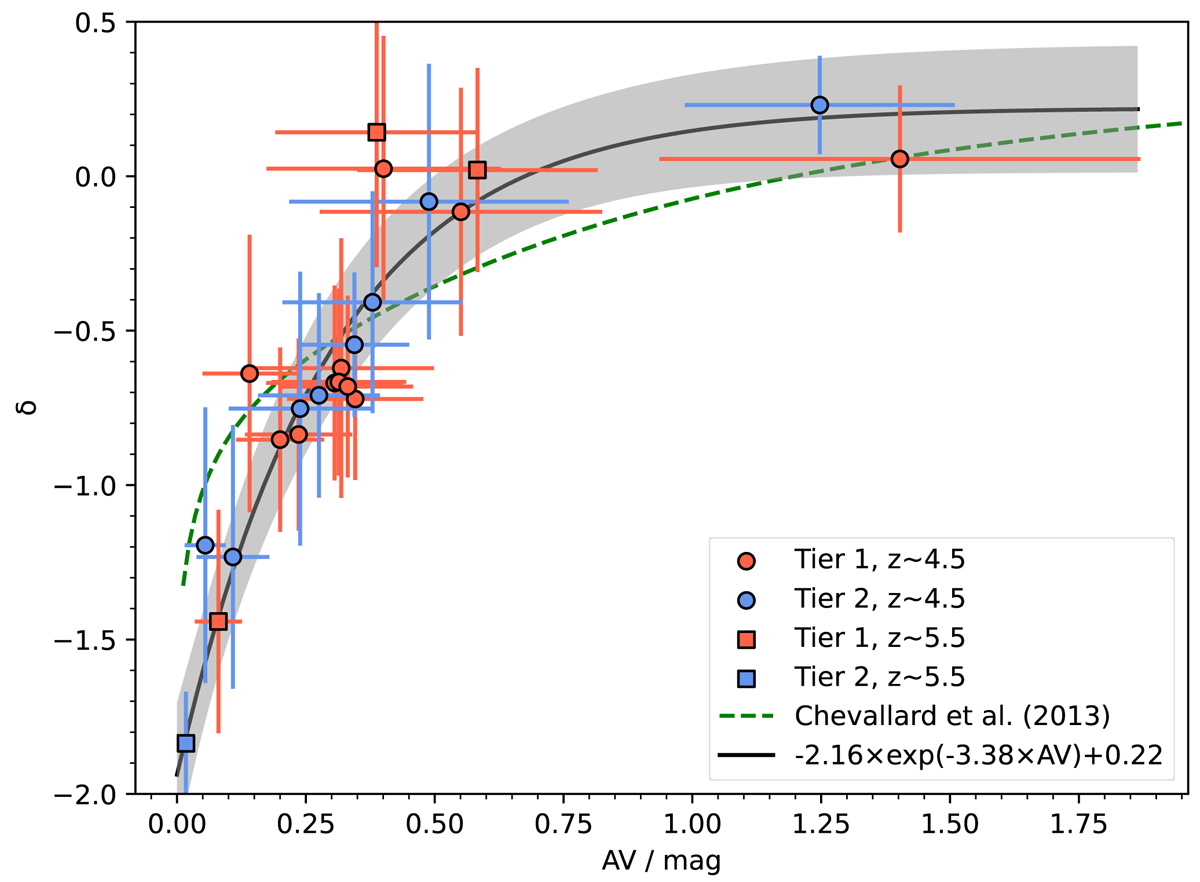
Fig. 7.
Download original image
Index δ of the power law modifying the starburst attenuation curve versus the V band attenuation. The symbols are identical to those of Fig. 3. The black line corresponds to the fit of a function of the form a × exp(b×AV) + c using an orthogonal distance regression method, with the gray area representing the 1-σ dispersion. The dashed green line represents the model of Chevallard et al. (2013) as described in Sect. 5.2. We see that there is a clear relation between the V-band attenuation and δ, with higher attenuation galaxies having a shallower attenuation curve. Such a variation is expected. It has been found in models and simulations alike.
Current usage metrics show cumulative count of Article Views (full-text article views including HTML views, PDF and ePub downloads, according to the available data) and Abstracts Views on Vision4Press platform.
Data correspond to usage on the plateform after 2015. The current usage metrics is available 48-96 hours after online publication and is updated daily on week days.
Initial download of the metrics may take a while.