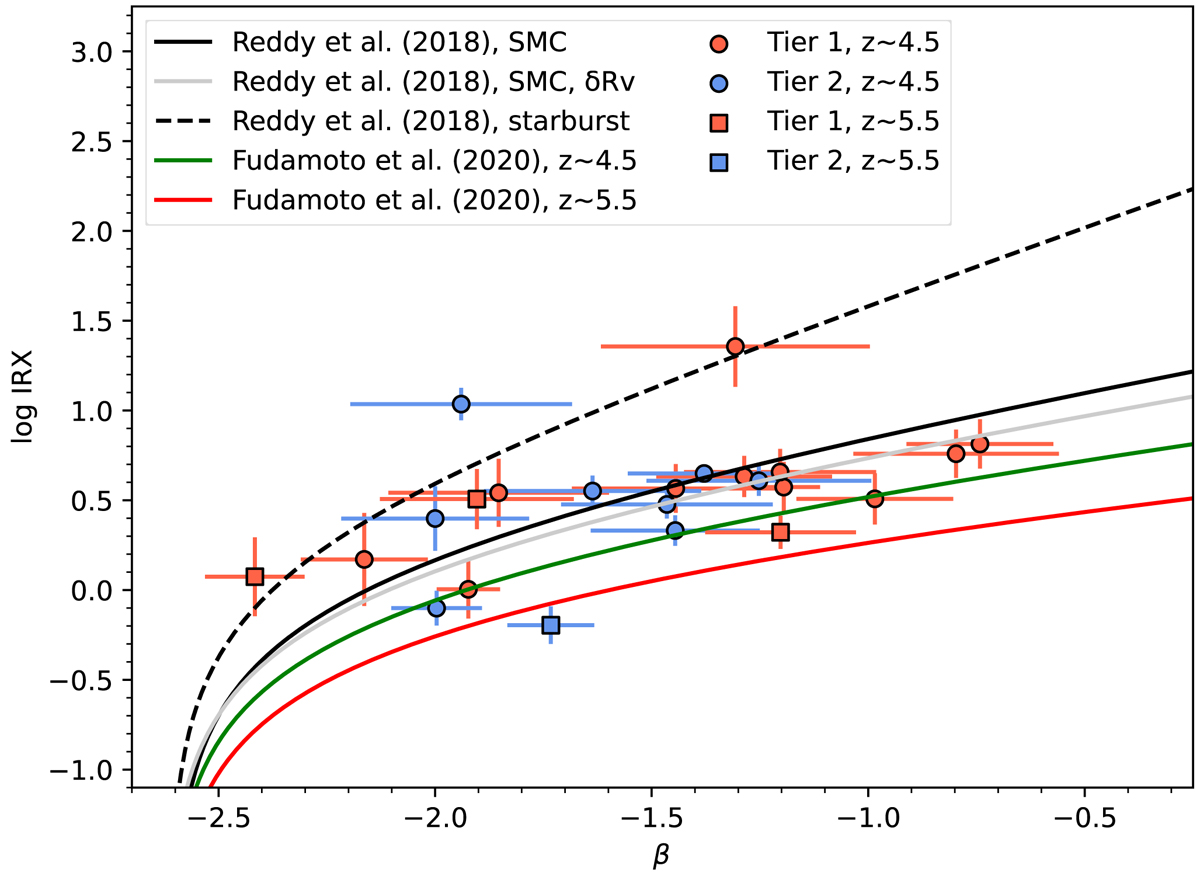
Fig. 5.
Download original image
Relation between IRX and β as estimated by CIGALE in our sample. The symbols are identical to those of Fig. 3. The lines correspond to different previously published relations. The dashed black, solid black and gray lines respectively correspond to the starburst, unmodified SMC, and SMC with a modified Rv attenuation curves, as published in Reddy et al. (2018). The green and red lines correspond to relations derived by Fudamoto et al. (2020a) for stacked ALPINE galaxies at z ∼ 4.5 and z ∼ 5.5, respectively. The reasonably small range in the intrinsic UV slope β0 and the distribution of the data with respect to various relations suggest that the dispersion is driven by variations of the attenuation curves across the sample.
Current usage metrics show cumulative count of Article Views (full-text article views including HTML views, PDF and ePub downloads, according to the available data) and Abstracts Views on Vision4Press platform.
Data correspond to usage on the plateform after 2015. The current usage metrics is available 48-96 hours after online publication and is updated daily on week days.
Initial download of the metrics may take a while.