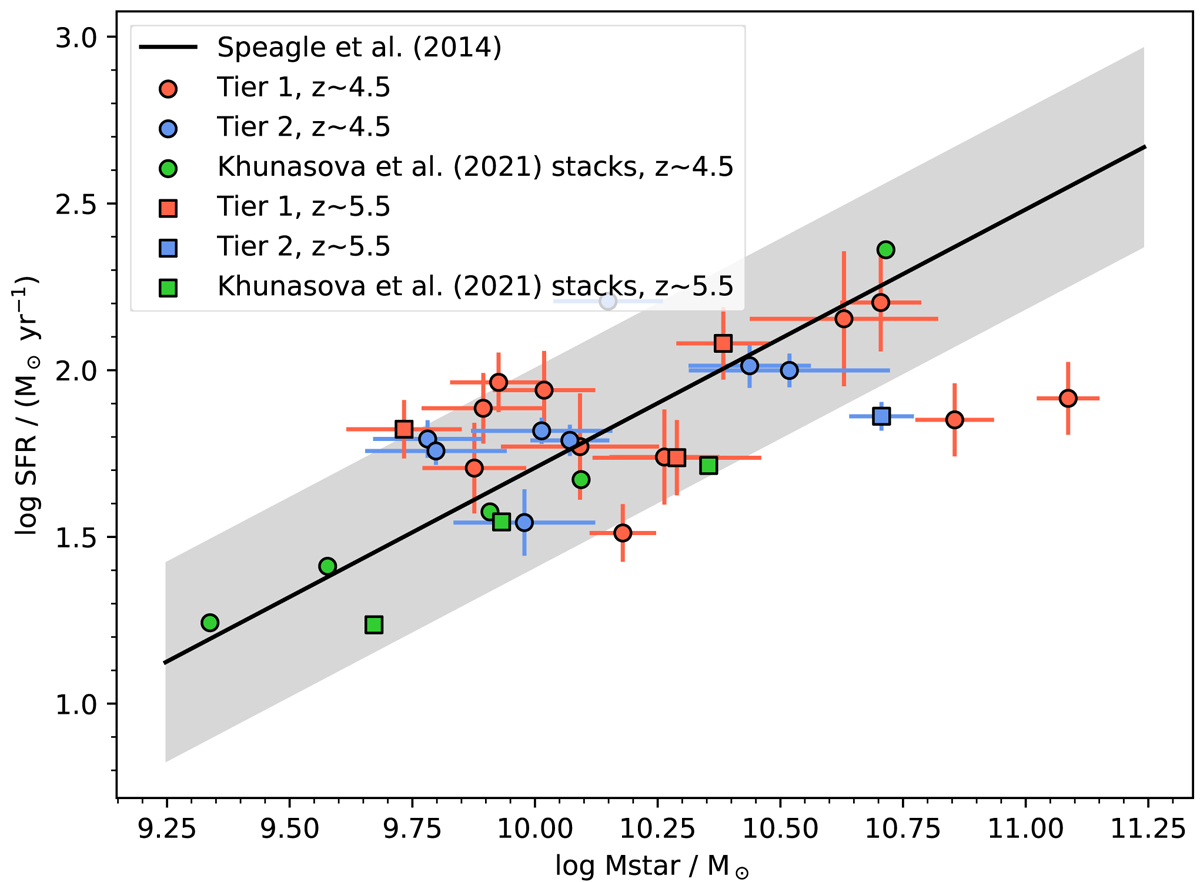
Fig. 4.
Download original image
Relation between the SFR and M⋆ as estimated by CIGALE for our sample. The symbols are identical to those of Fig. 3, with the addition of the stacks of Khusanova et al. (2021) in green. The black line corresponds to the relation derived by Speagle et al. (2014) at z ∼ 5, converted from a Kroupa (2001) to a Chabrier (2003) IMF. The shaded area corresponds to a typical ±0.3 dex scatter in SFR. We see that it forms a well-defined sequence over approximately a dex in both SFR and M⋆ and matches the relation inferred by Speagle et al. (2014). This is expected as the original ALPINE sample was constructed to contain normal star-forming galaxies.
Current usage metrics show cumulative count of Article Views (full-text article views including HTML views, PDF and ePub downloads, according to the available data) and Abstracts Views on Vision4Press platform.
Data correspond to usage on the plateform after 2015. The current usage metrics is available 48-96 hours after online publication and is updated daily on week days.
Initial download of the metrics may take a while.