Fig. 3.
Download original image
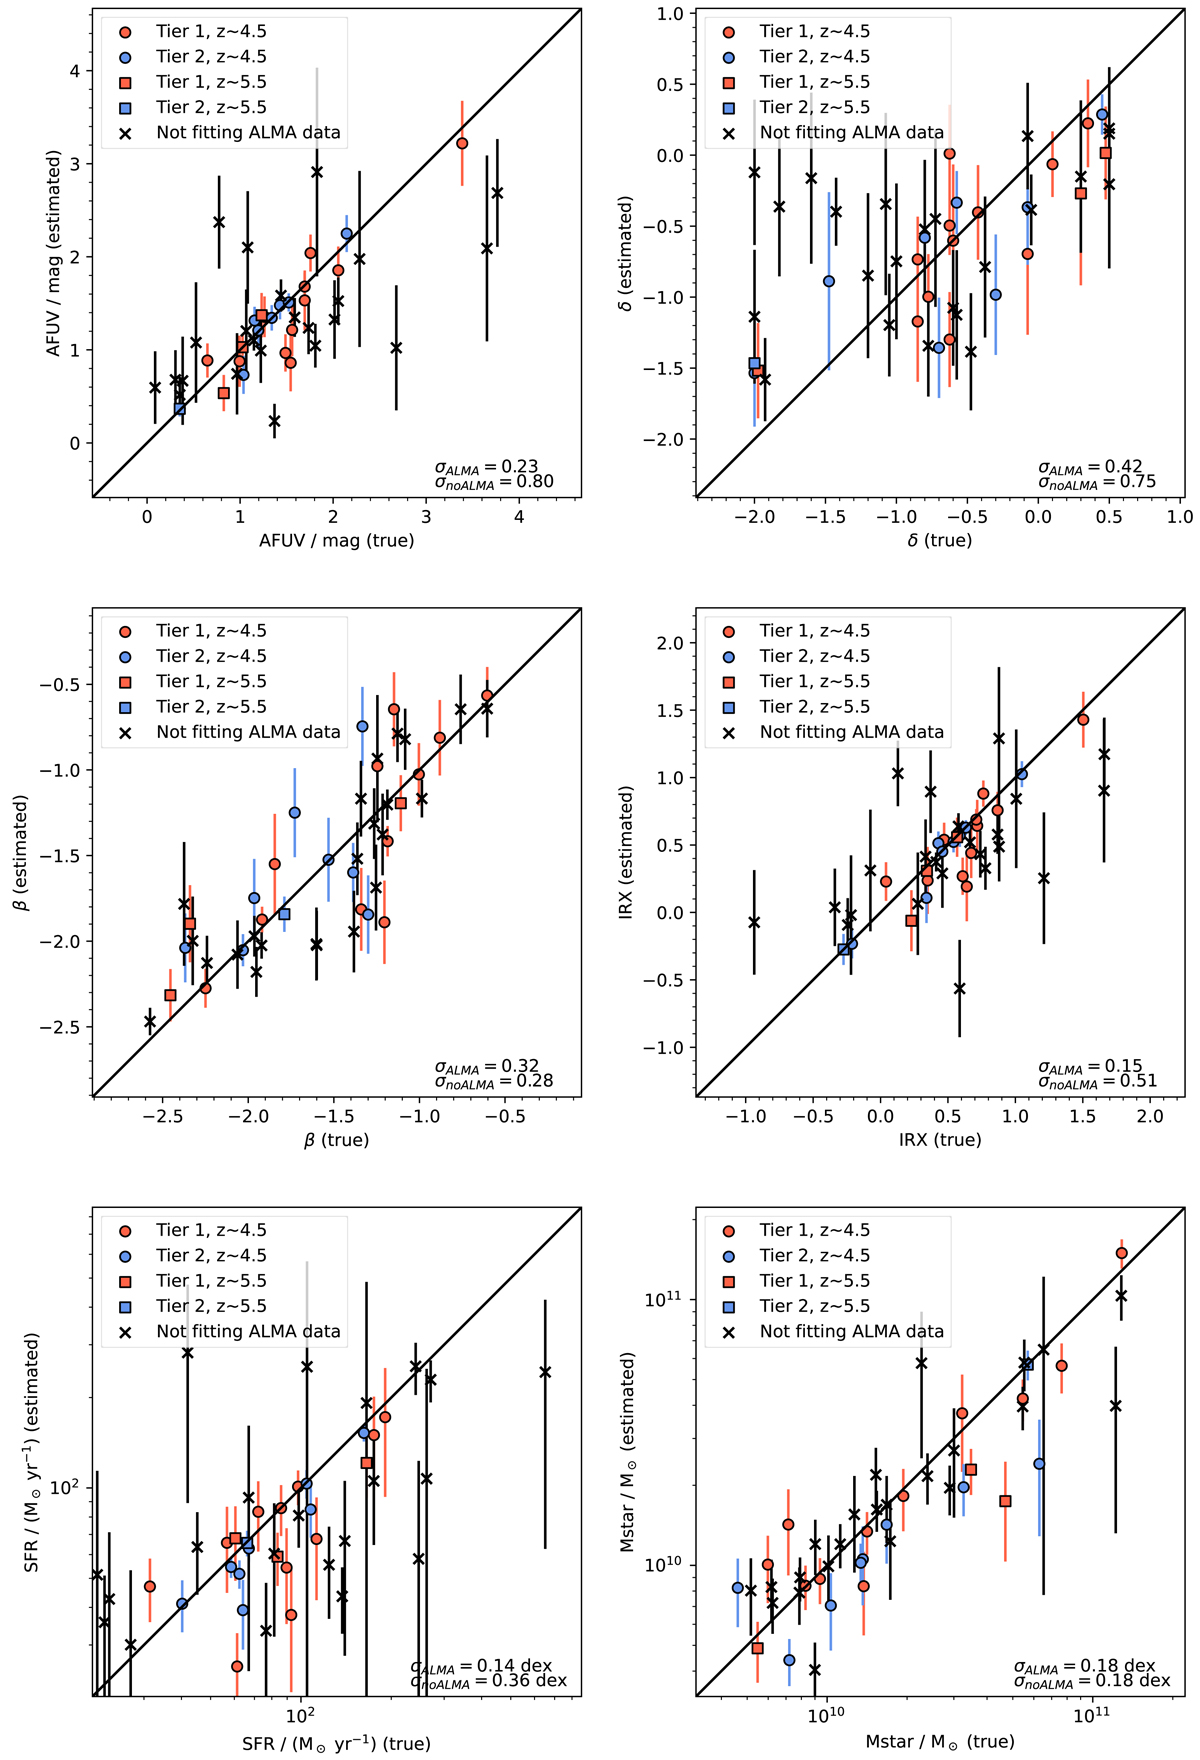
Comparison of the true (x axis) and estimated values (y axis) for AFUV, δ, β, IRX, SFR, and M⋆, from top-left to bottom-right. The solid black line indicates the one-to-one relation. The red (blue) symbols represent galaxies detected in the continuum at 158 μm rest-frame (detected only in the [C II] line). The black crosses represent the same objects when the ALMA data ([C II] and/or 158 μm continuum) are not taken into account in the fit, essentially limiting it to rest-frame UV and optical observations. The inclusion of ALMA data visibly improves the estimates of many of the physical properties. For a physical property as difficult to estimate as the slope of the attenuation curve δ, the inclusion of ALMA data is decisive. Even though the scatter remains important, in particular for the steepest (most negative δ) curves, this is a considerable progress compared to the situation without ALMA observations for which constraints are much more lax. The standard deviation of the physical properties estimated with and without ALMA data is indicated in the bottom-right corner of each panel.
Current usage metrics show cumulative count of Article Views (full-text article views including HTML views, PDF and ePub downloads, according to the available data) and Abstracts Views on Vision4Press platform.
Data correspond to usage on the plateform after 2015. The current usage metrics is available 48-96 hours after online publication and is updated daily on week days.
Initial download of the metrics may take a while.