Fig. 2.
Download original image
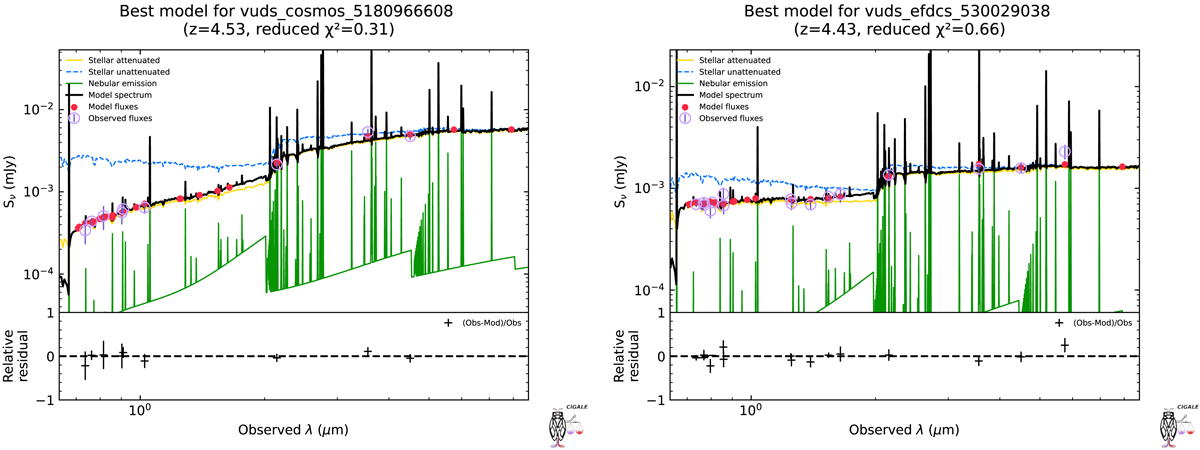
Best fits of galaxies vuds_cosmos_5180966608 at z = 4.53 (left) and vuds_efdcs_530029038 at z = 4.43 (right). The galaxy spectra are shown in black, with the dust-attenuated stellar populations in yellow and the ionized gas in green. For comparison, the dust-free stellar populations are shown in blue. The model fluxes integrated in passbands are shown as red circles and the observations and 1-σ uncertainties are indicated with purple circles with vertical lines. Finally, the relative residuals are shown in the bottom panels of each plot.
Current usage metrics show cumulative count of Article Views (full-text article views including HTML views, PDF and ePub downloads, according to the available data) and Abstracts Views on Vision4Press platform.
Data correspond to usage on the plateform after 2015. The current usage metrics is available 48-96 hours after online publication and is updated daily on week days.
Initial download of the metrics may take a while.