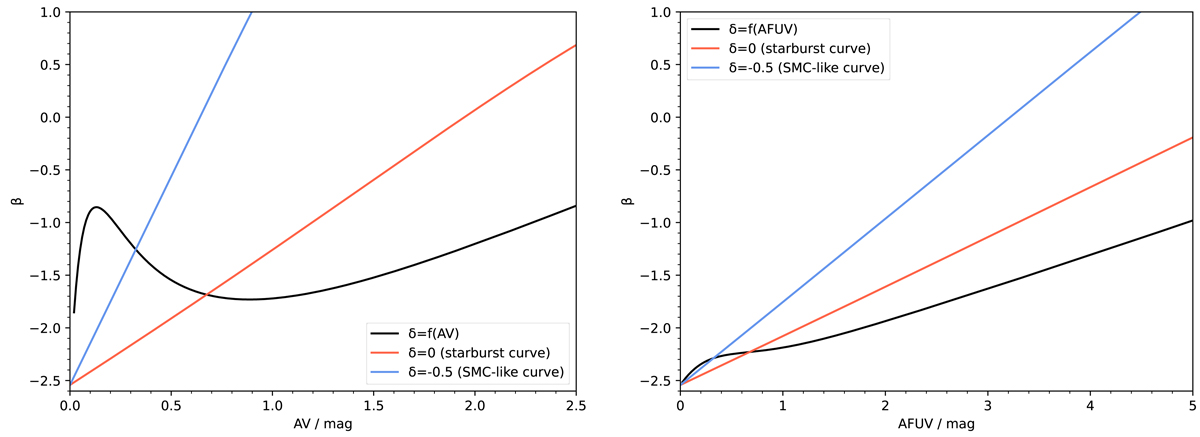
Fig. 11.
Download original image
Observed UV slope β as a function of the V-band (left) and FUV (right) attenuation (black), assuming the relation between the attenuation curve slope δ and the attenuation shown in Fig. 7. For comparison the evolution of β for starburst and SMC-like attenuation curves are shown in red and blue, respectively. We see that the evolution of β with the attenuation follows a very different track compared to the starburst and SMC curves. The consequence is that, in the case of main-sequence galaxies at z ∼ 5, β cannot easily be used to infer the attenuation of galaxies
Current usage metrics show cumulative count of Article Views (full-text article views including HTML views, PDF and ePub downloads, according to the available data) and Abstracts Views on Vision4Press platform.
Data correspond to usage on the plateform after 2015. The current usage metrics is available 48-96 hours after online publication and is updated daily on week days.
Initial download of the metrics may take a while.