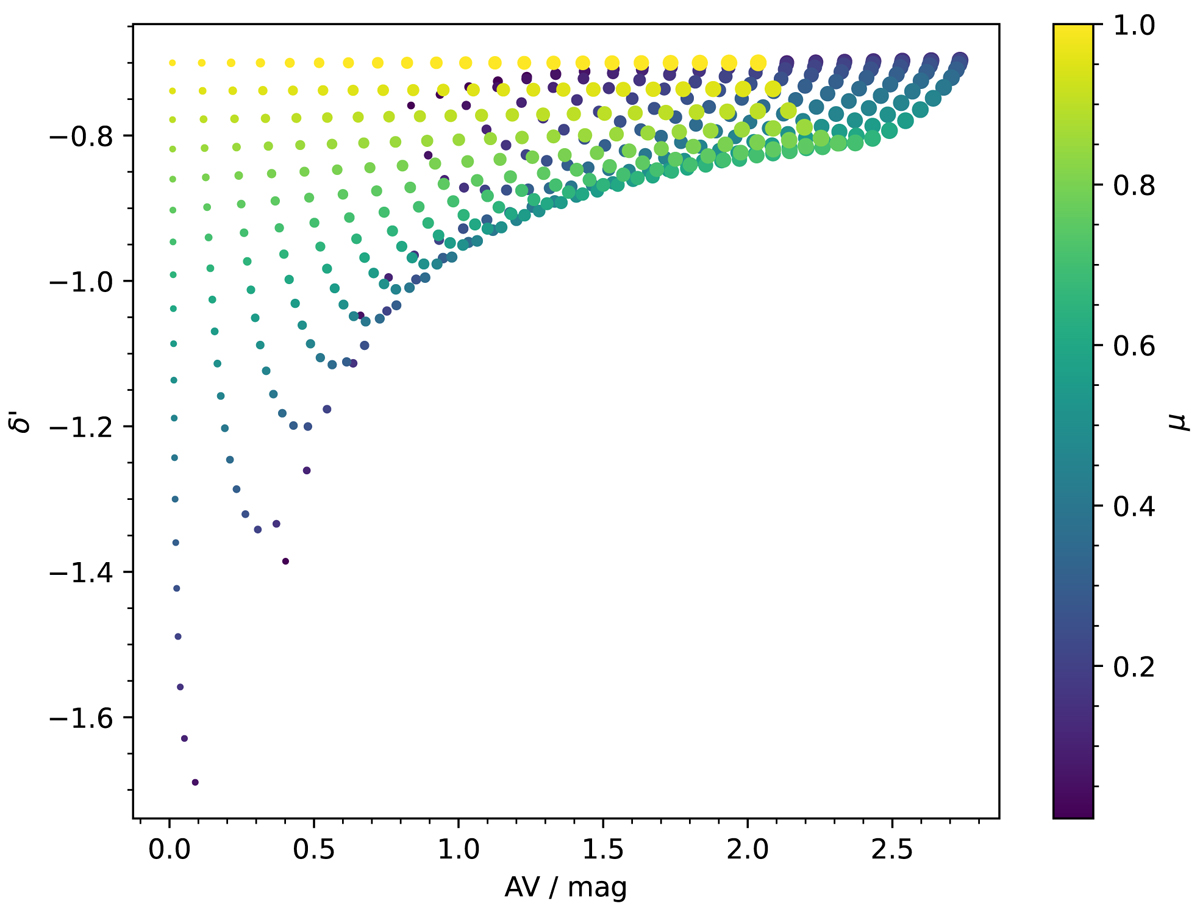
Fig. 10.
Download original image
Index δ′ of the power law describing the effective attenuation curve versus the attenuation in the V band for the Charlot & Fall (2000) model. The size of the points is proportional to the V band ISM attenuation from 0.01 mag to 2 mag and the color gives μ, the fraction of the dust in the ISM following the color bar to the right of the figure. For reference, a starburst curve corresponds to δ′≃ − 0.7. We see that in the low AV and low μ regime, the attenuation curve can become much steeper.
Current usage metrics show cumulative count of Article Views (full-text article views including HTML views, PDF and ePub downloads, according to the available data) and Abstracts Views on Vision4Press platform.
Data correspond to usage on the plateform after 2015. The current usage metrics is available 48-96 hours after online publication and is updated daily on week days.
Initial download of the metrics may take a while.