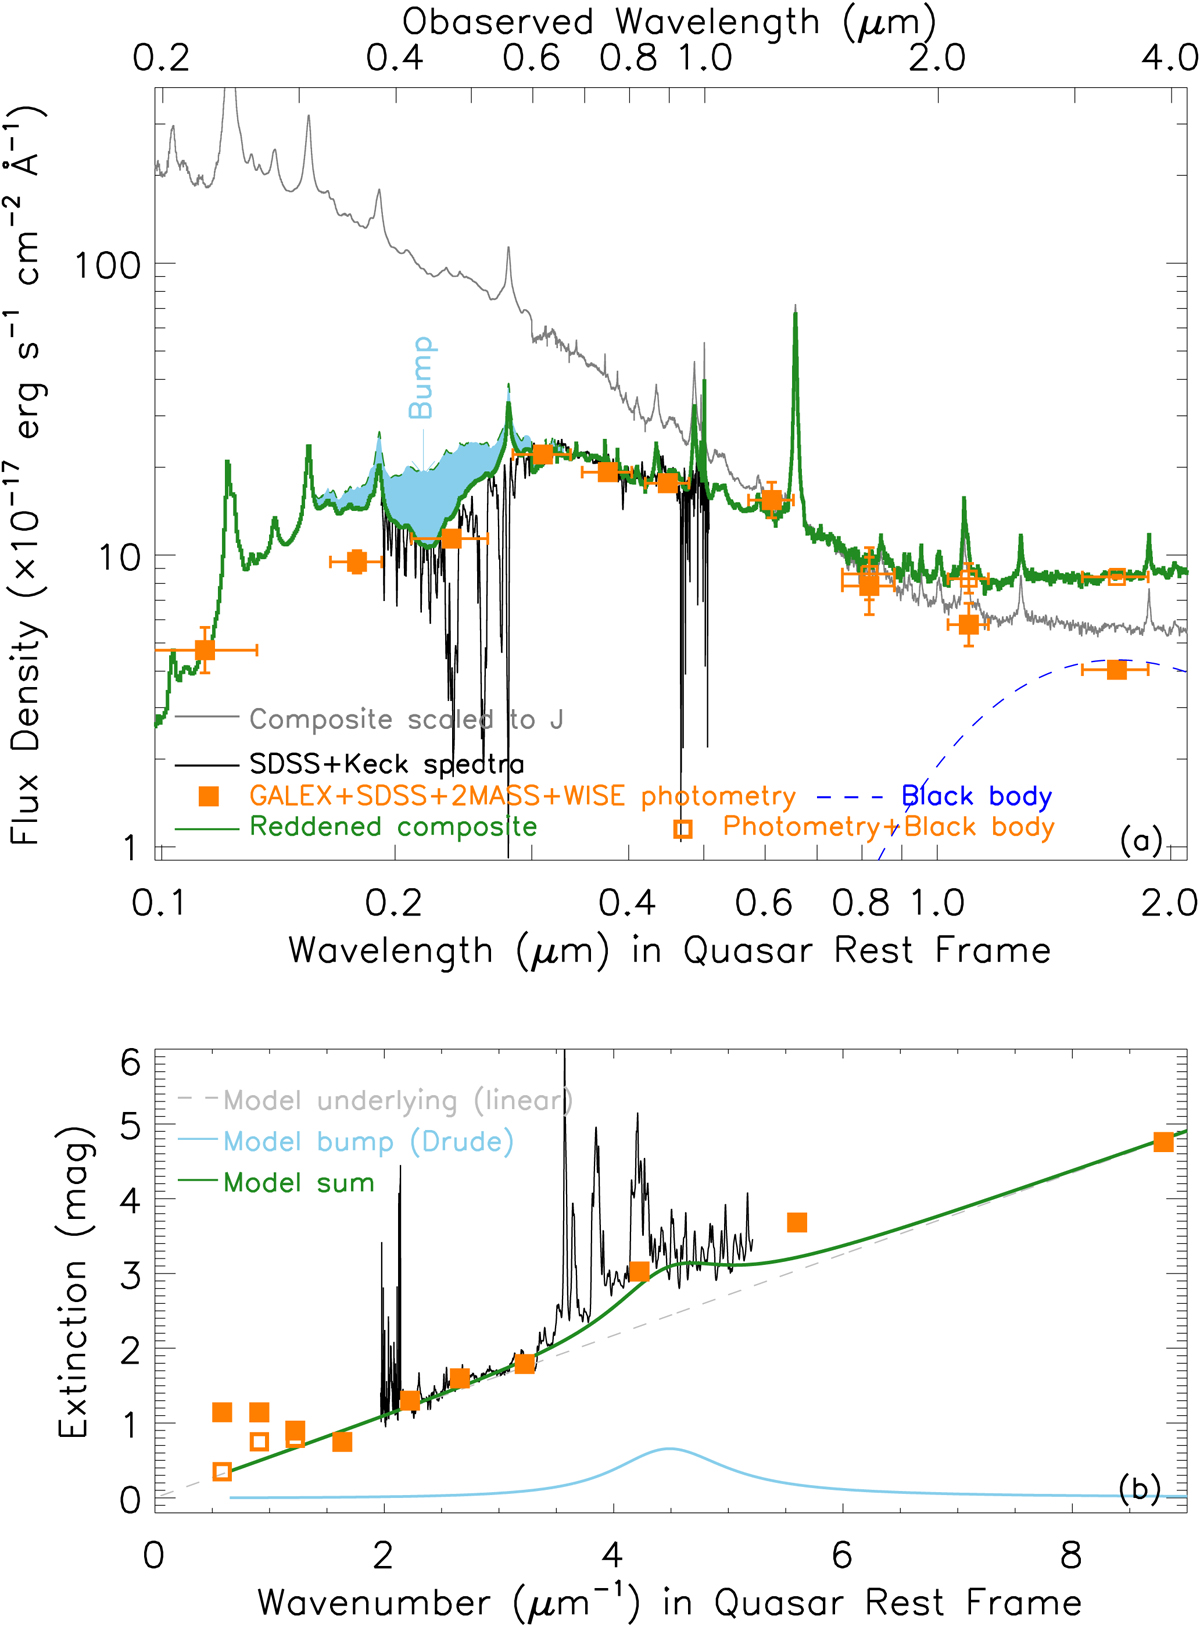
Fig. A.1.
Download original image
Same as Fig. 3, but for SDSS J1020+6023. Dust emission with T ∼ 1700 K (dashed blue line) is added to the near-IR magnitudes to better match the composite because the near-IR composite from Glikman et al. (2006) has a stronger IR emission than SDSS J1020+6023. The correctional multi-band magnitudes of SDSS J1020+6023 from the 2MASS and WISE surveys are presented by open orange squares.
Current usage metrics show cumulative count of Article Views (full-text article views including HTML views, PDF and ePub downloads, according to the available data) and Abstracts Views on Vision4Press platform.
Data correspond to usage on the plateform after 2015. The current usage metrics is available 48-96 hours after online publication and is updated daily on week days.
Initial download of the metrics may take a while.