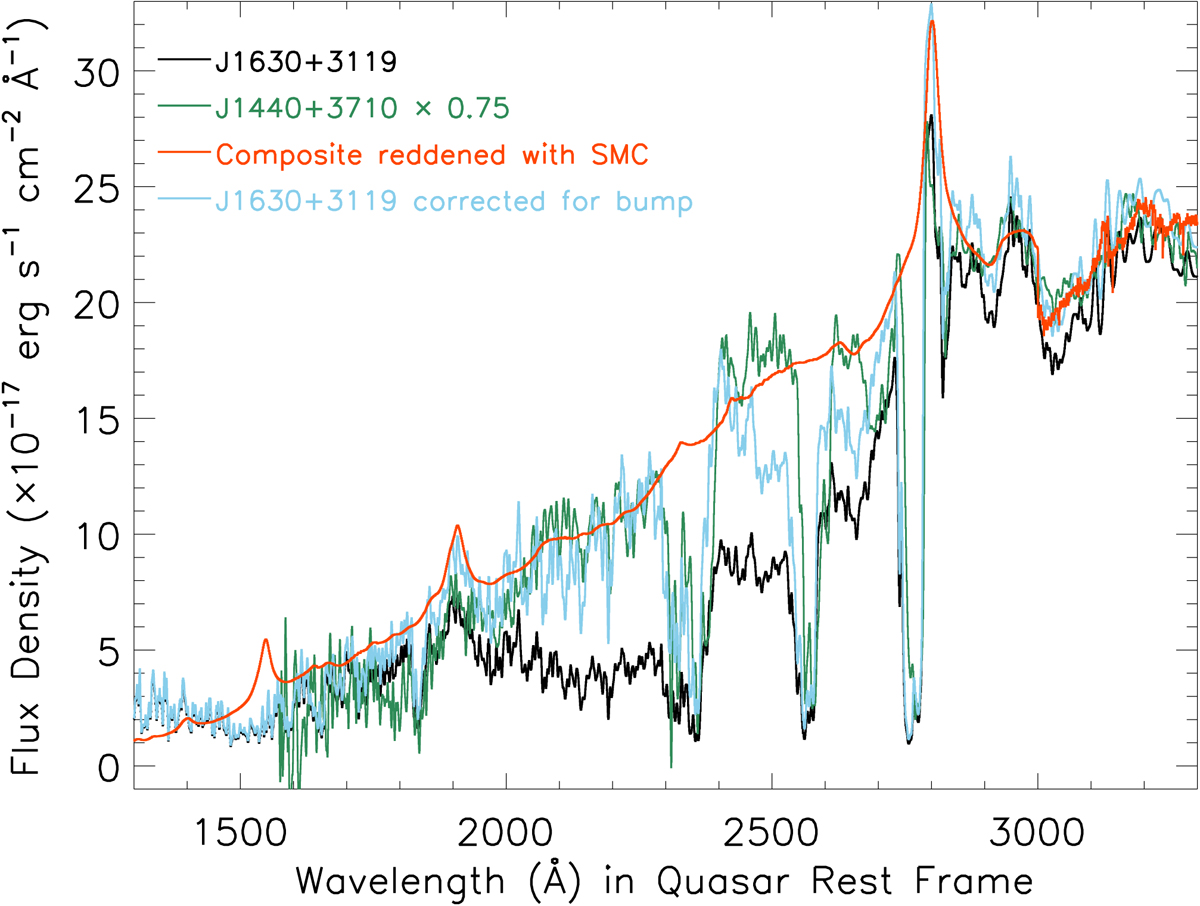
Fig. 5.
Download original image
Comparison of the corrected spectrum of SDSS J1630+3119 bump reddening (sky blue curve) and observed spectra of SDSS J1630+3119 and J1440+3710. The corrected spectrum agrees very well with the observed spectrum of SDSS J1440+3710 (also shown in Fig. 2 by the green curve), and both spectra follow the reddened quasar composite (red curve) by the SMC extinction curve of E(B − V) = 0.46 very well. The continuum difference between SDSS J1630+3119 and SDSS J1440+3710 is probably the 2175 Å bump feature.
Current usage metrics show cumulative count of Article Views (full-text article views including HTML views, PDF and ePub downloads, according to the available data) and Abstracts Views on Vision4Press platform.
Data correspond to usage on the plateform after 2015. The current usage metrics is available 48-96 hours after online publication and is updated daily on week days.
Initial download of the metrics may take a while.