Fig. 4.
Download original image
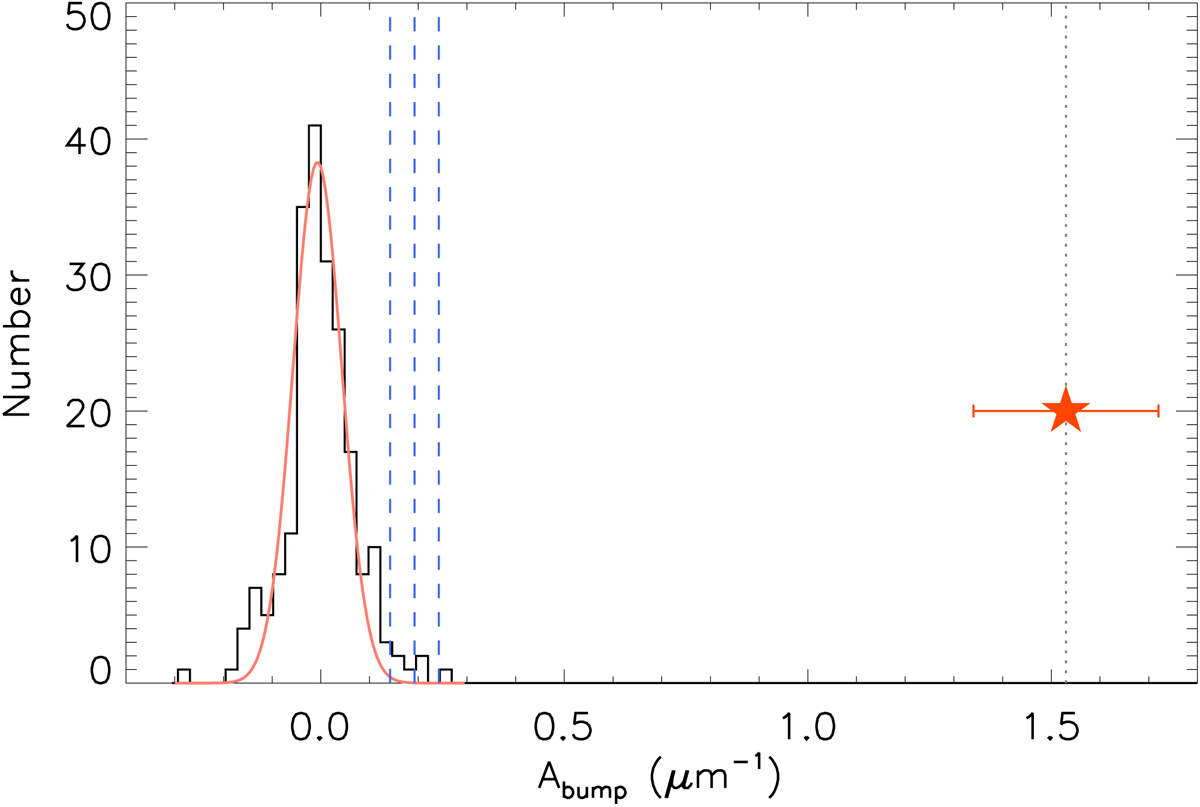
Histogram of fitted bump strengths of the control sample for SDSS J1630+3119. The solid pink line is the best-fitting Gaussian profile. Three vertical dashed blue lines indicate the 3σ, 4σ, and 5σ boundaries of the Gaussian profile. The red star indicates the bump strength derived in the spectrum of SDSS J1630+3119, which has an extremely high statistical significance level.
Current usage metrics show cumulative count of Article Views (full-text article views including HTML views, PDF and ePub downloads, according to the available data) and Abstracts Views on Vision4Press platform.
Data correspond to usage on the plateform after 2015. The current usage metrics is available 48-96 hours after online publication and is updated daily on week days.
Initial download of the metrics may take a while.