Fig. 5
Download original image
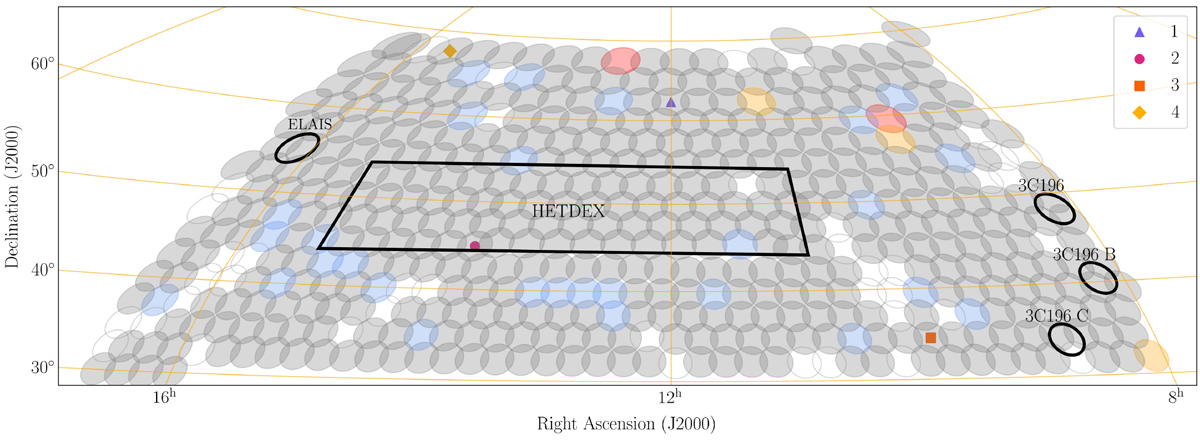
Mosaic coverage shown in equatorial coordinates. Radii of the circles correspond to the largest primary beam FWHM of the LoTSS survey (4.75°). Red, orange, blue, and grey circles mark Faraday space resolution of 1.44, 1.23, 1.20, and 1.16 rad m−2, respectively (see Table 2). Areas previously studied by different authors are outlined in black (see Table 1 for more information). Symbols in the legend mark fields whose noise and spectra are shown in Figs. 1 and 3, where they are drawn with a corresponding colour and marked with numbers 1 through 4. Empty circles outlined in grey mark bad quality or missing observations.
Current usage metrics show cumulative count of Article Views (full-text article views including HTML views, PDF and ePub downloads, according to the available data) and Abstracts Views on Vision4Press platform.
Data correspond to usage on the plateform after 2015. The current usage metrics is available 48-96 hours after online publication and is updated daily on week days.
Initial download of the metrics may take a while.