Free Access
Fig. 4
Download original image
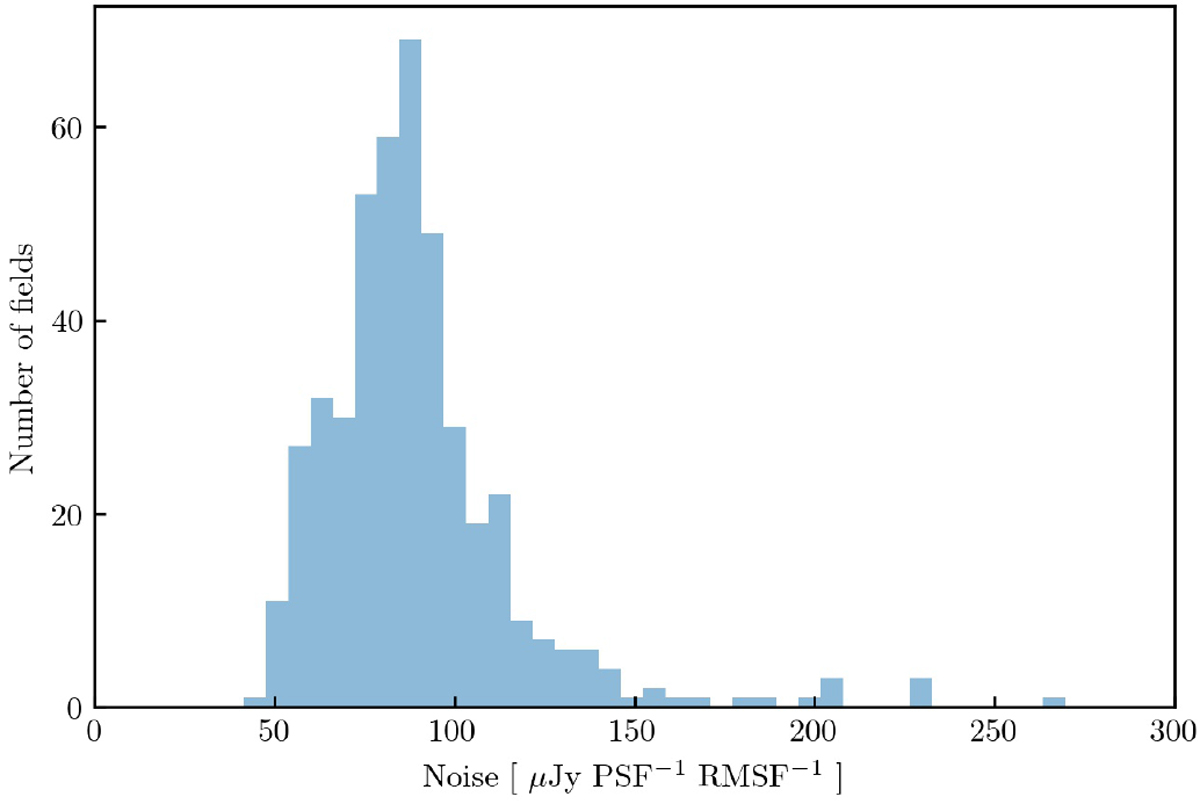
Histogram of noise in each polarised intensity cube, approximated as a standard deviation multiplied by a factor of aa42244-21 over each cube at Φ = −50 rad m−2. The mean value of this distribution represents the mean value of noise in the produced polarised intensity cubes.
Current usage metrics show cumulative count of Article Views (full-text article views including HTML views, PDF and ePub downloads, according to the available data) and Abstracts Views on Vision4Press platform.
Data correspond to usage on the plateform after 2015. The current usage metrics is available 48-96 hours after online publication and is updated daily on week days.
Initial download of the metrics may take a while.