Free Access
Fig. A.3
Download original image
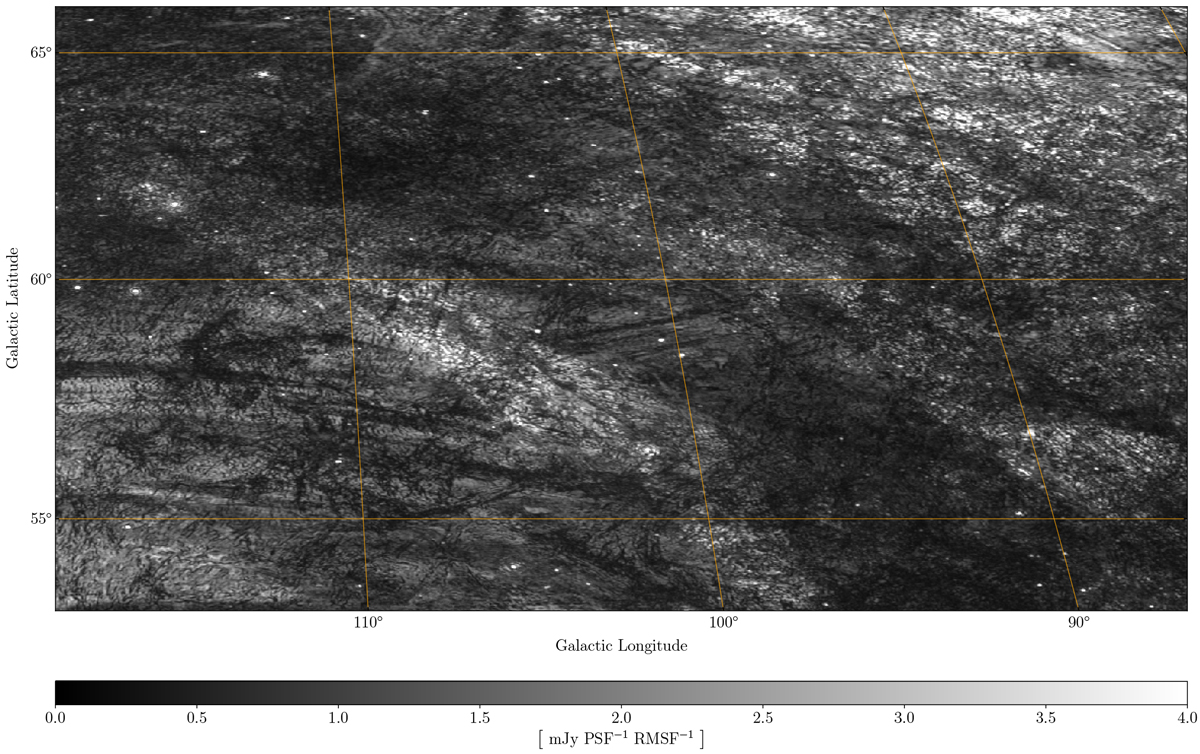
Zoom 3. Magnified maximum polarised intensity image, covering 7% of total mosaic area. The image shows the emission coming from the zig-zag structure mixed with Loop III emission (coming from the bottom left corner).
Current usage metrics show cumulative count of Article Views (full-text article views including HTML views, PDF and ePub downloads, according to the available data) and Abstracts Views on Vision4Press platform.
Data correspond to usage on the plateform after 2015. The current usage metrics is available 48-96 hours after online publication and is updated daily on week days.
Initial download of the metrics may take a while.