Free Access
Fig. 16
Download original image
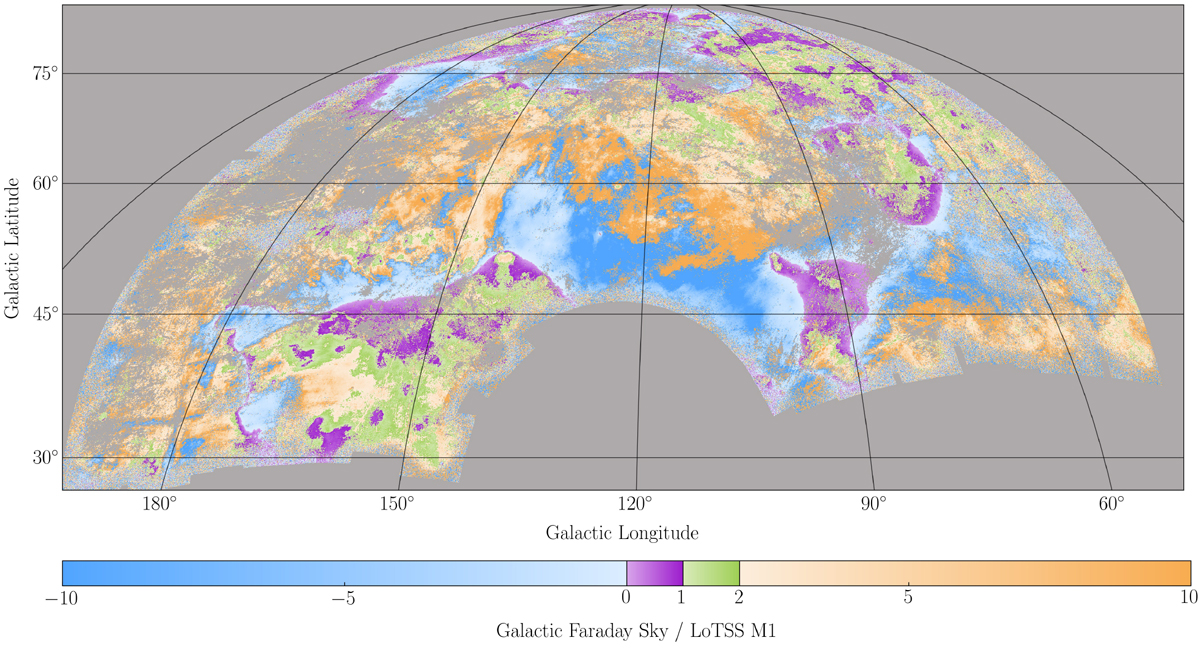
Map of the Galactic Faraday Sky to LoTSS first moment ratio. The blue colour marks the area where the two data sets trace different structures. Purple marks ratios lower than 1, green represents ratios in range from 1 to 2, and orange marks ratios higher than 2.
Current usage metrics show cumulative count of Article Views (full-text article views including HTML views, PDF and ePub downloads, according to the available data) and Abstracts Views on Vision4Press platform.
Data correspond to usage on the plateform after 2015. The current usage metrics is available 48-96 hours after online publication and is updated daily on week days.
Initial download of the metrics may take a while.