Fig. 15
Download original image
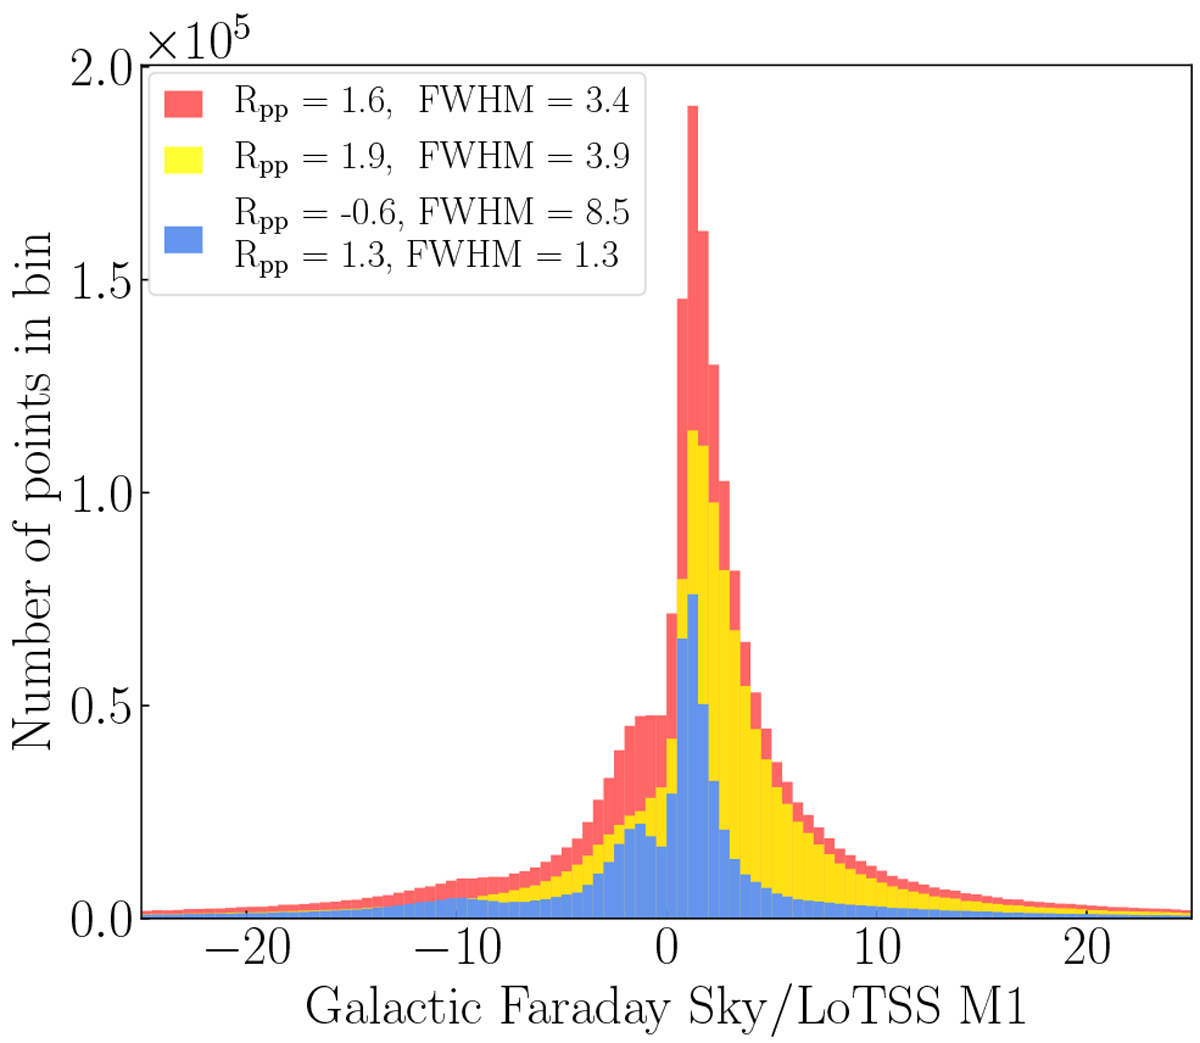
Histogram of the Galactic Faraday Sky to LoTSS first moment ratio in different regions. Blue and yellow histograms display the lower and the upper region, respectively. The red histogram displays both regions combined. We used a Lorentzian fit to characterise the histograms; the obtained ratio peak positions (Rpp) and FWHMs are given in the legend above the plot.
Current usage metrics show cumulative count of Article Views (full-text article views including HTML views, PDF and ePub downloads, according to the available data) and Abstracts Views on Vision4Press platform.
Data correspond to usage on the plateform after 2015. The current usage metrics is available 48-96 hours after online publication and is updated daily on week days.
Initial download of the metrics may take a while.