Fig. 11
Download original image
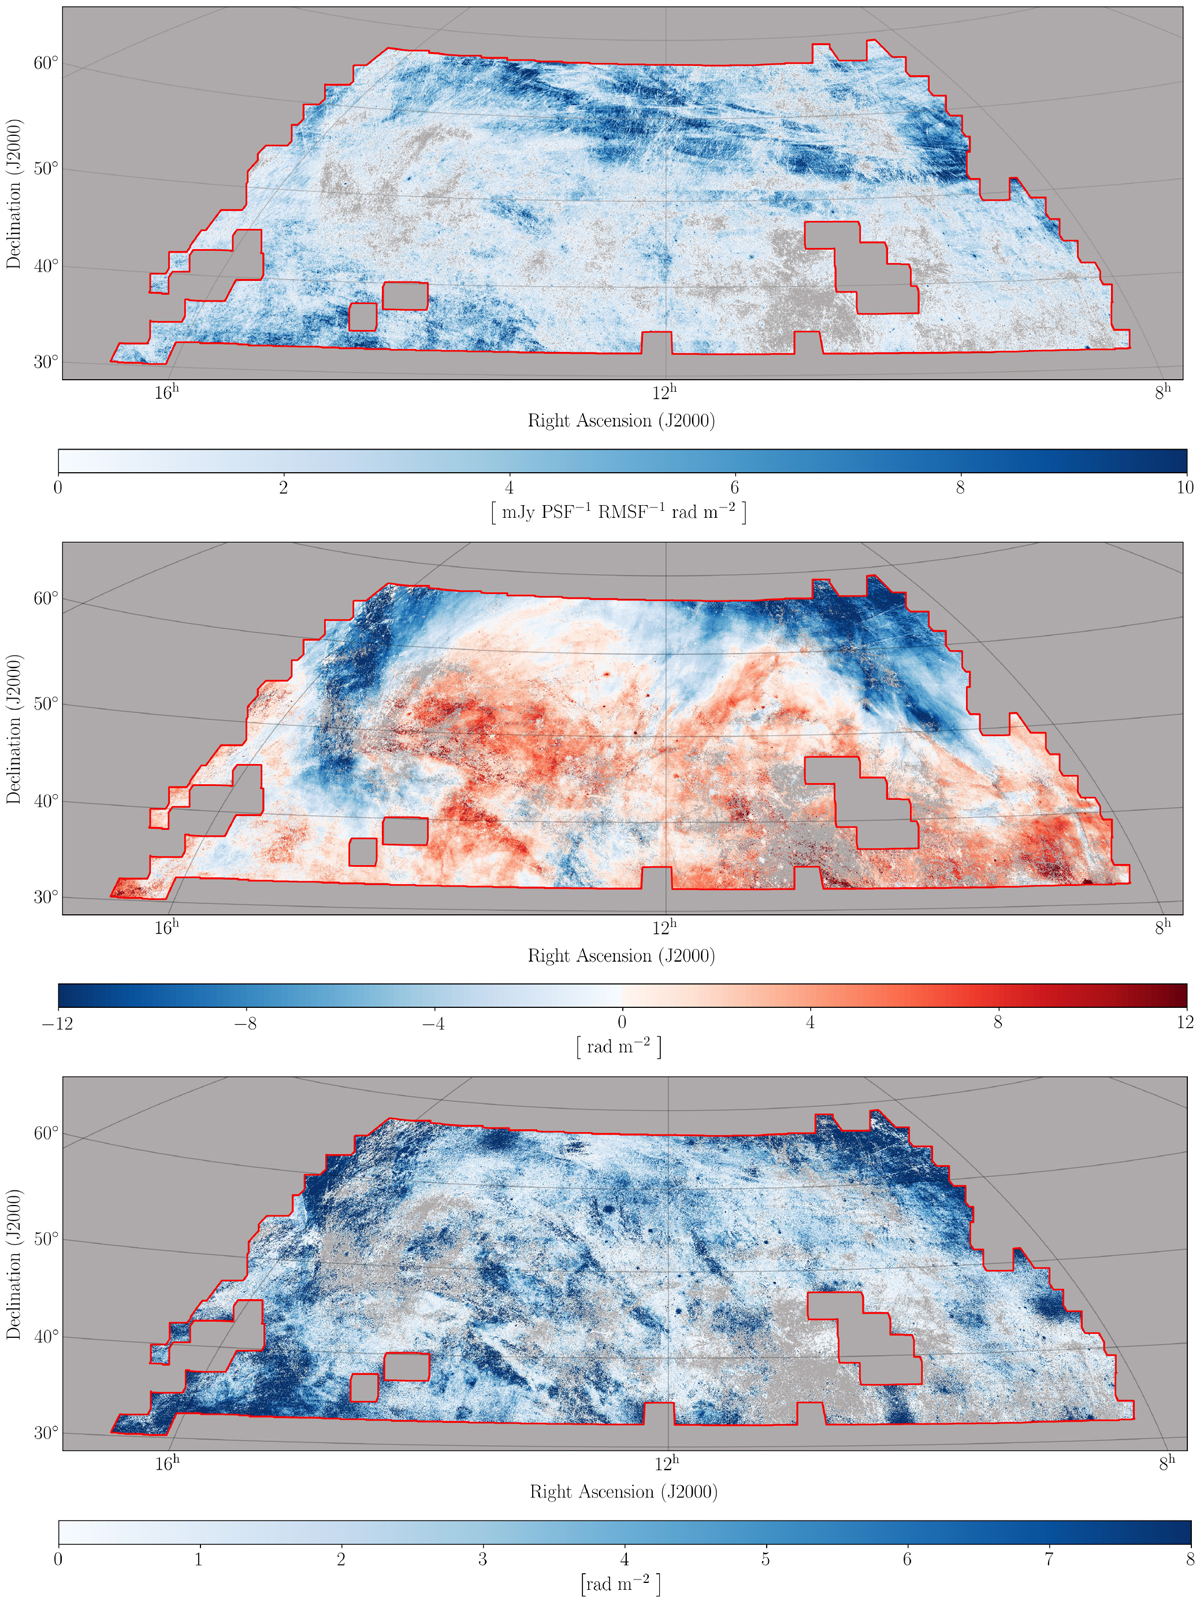
Moments of the Faraday cubes. The top panel shows the zeroth moment image representing the total polarised intensity. The middle panel shows the first moment image representing the intensity weighted mean Faraday depth value. The bottom panel shows the square root of the second moment image representing the spread of spectra around first moment values. All images are in equatorial coordinates. The red line outlines mask edges.
Current usage metrics show cumulative count of Article Views (full-text article views including HTML views, PDF and ePub downloads, according to the available data) and Abstracts Views on Vision4Press platform.
Data correspond to usage on the plateform after 2015. The current usage metrics is available 48-96 hours after online publication and is updated daily on week days.
Initial download of the metrics may take a while.