Fig. 10
Download original image
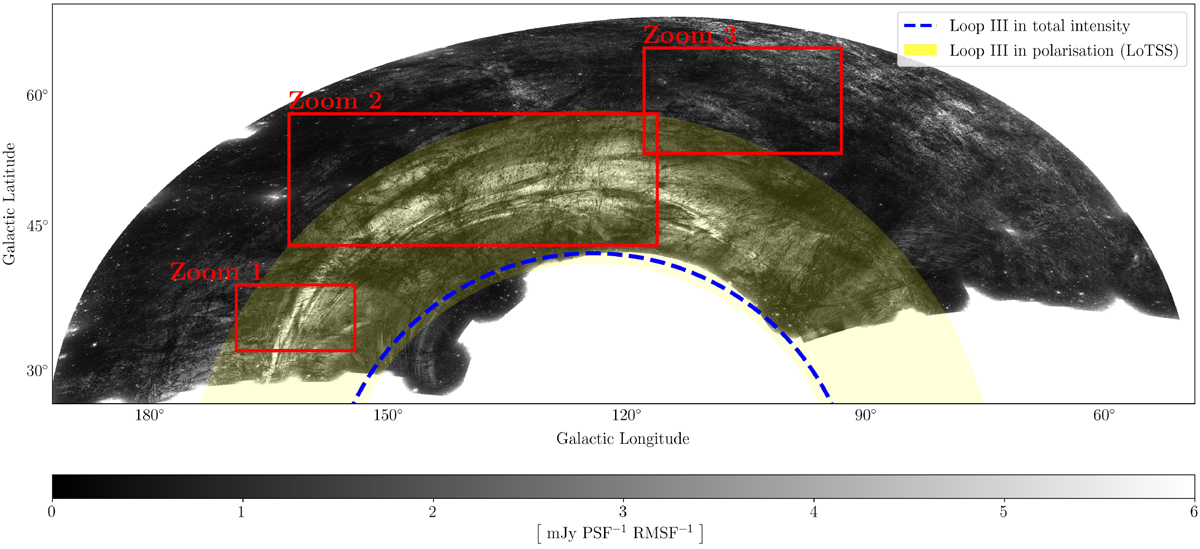
Maximum polarised intensity image given in Galactic coordinates (Mollweide projection) with some of the interesting features outlined. The area shaded in yellow is the area in which we see Loop III in LoTSS data. The blue dashed line represents the location of Loop III in total intensity as seen by Berkhuijsen (1971). Red rectangles mark areas that are magnified in Figs. A.1-A.3.
Current usage metrics show cumulative count of Article Views (full-text article views including HTML views, PDF and ePub downloads, according to the available data) and Abstracts Views on Vision4Press platform.
Data correspond to usage on the plateform after 2015. The current usage metrics is available 48-96 hours after online publication and is updated daily on week days.
Initial download of the metrics may take a while.