Fig. 6.
Download original image
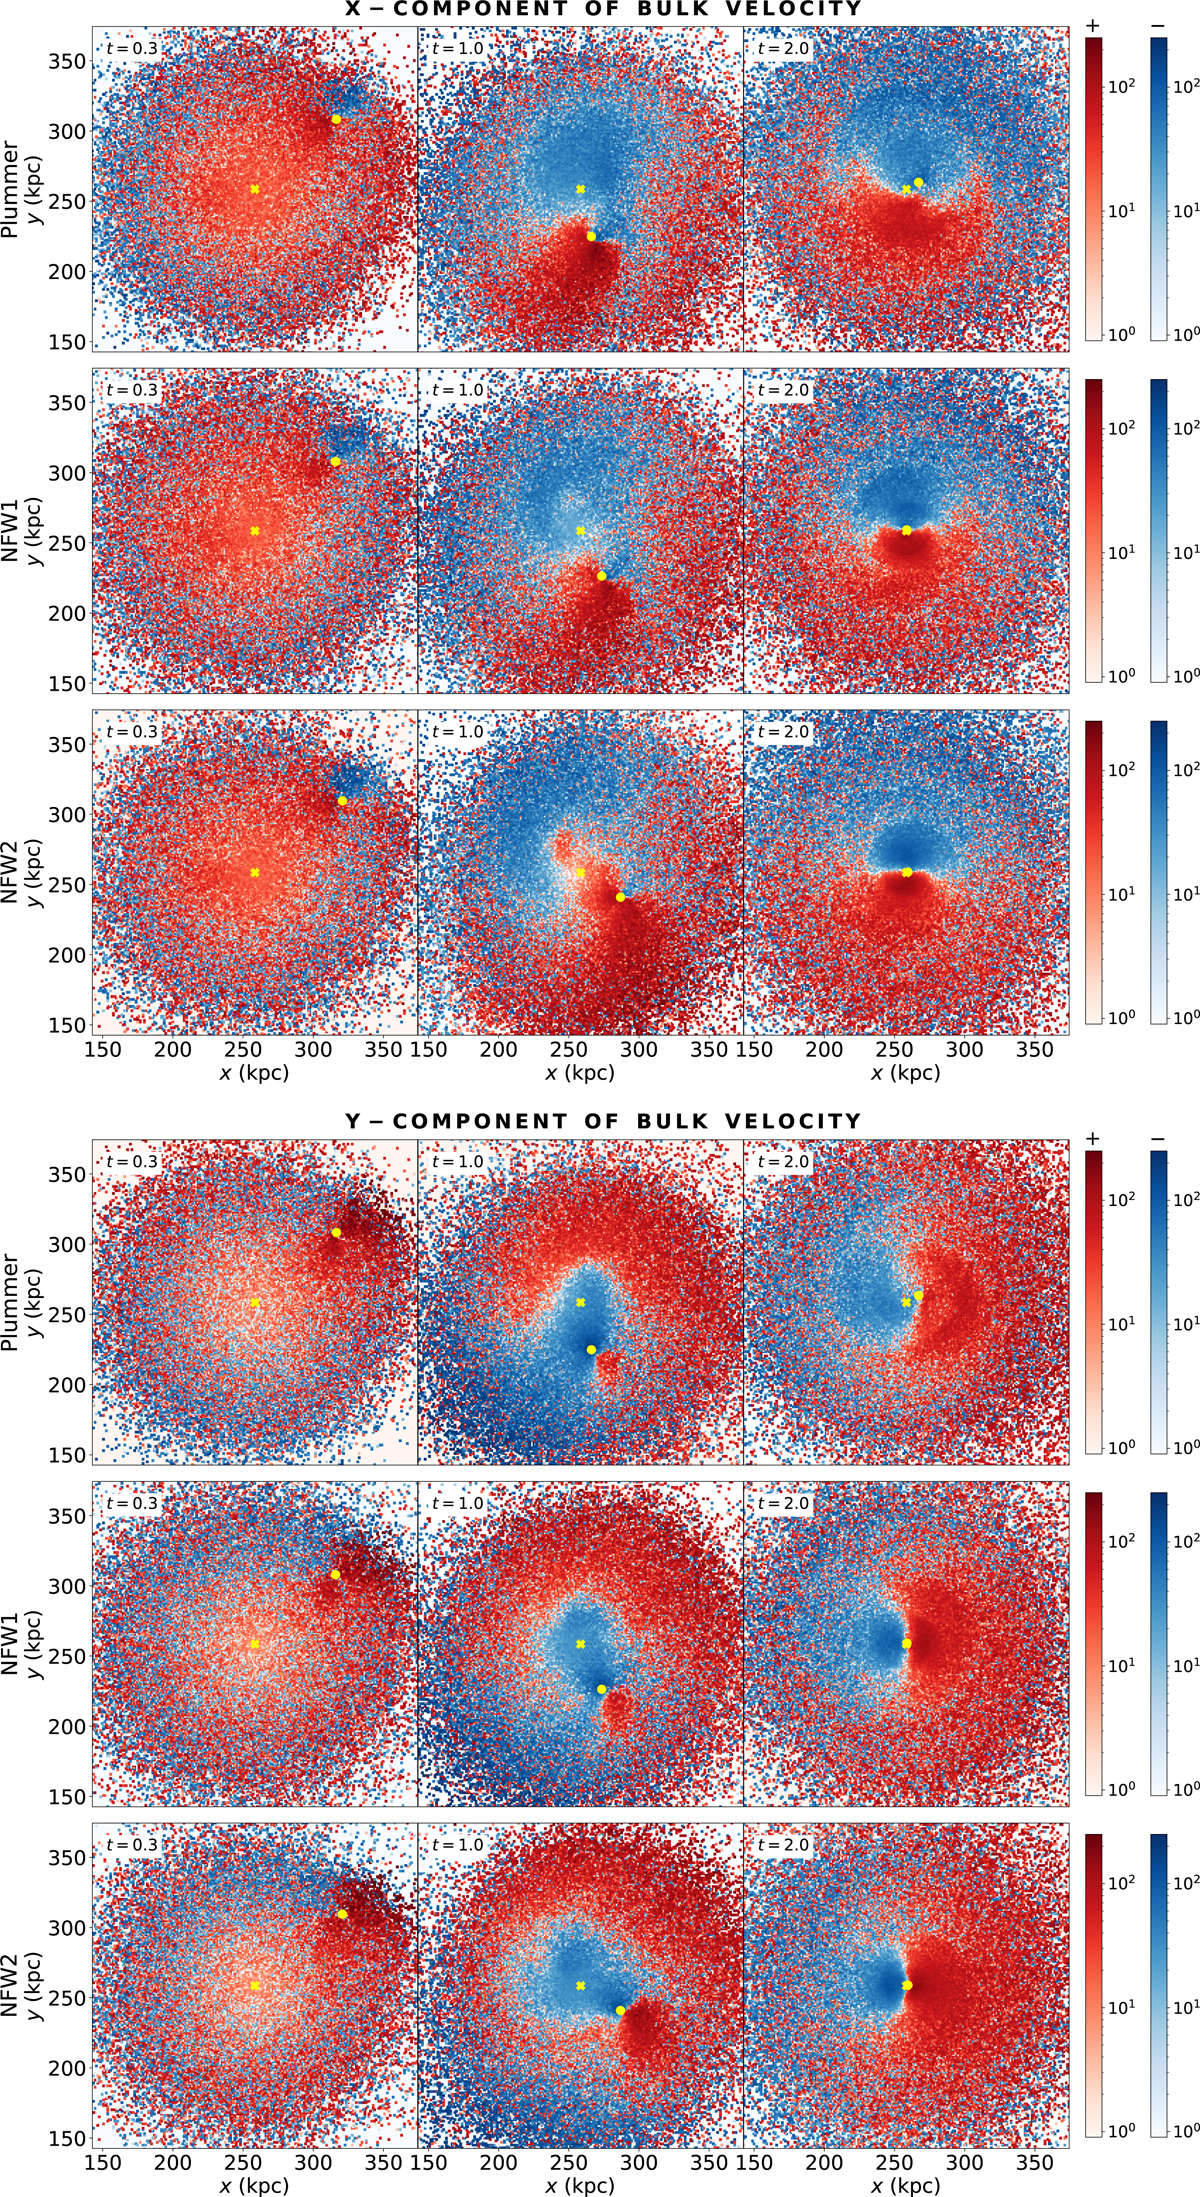
Velocity maps. The map shows the X (upper) and Y (lower) bulk velocity components (positive red, negative blue). As in Fig. 3, the columns correspond to, from left to right, t = 0.3, 1.0, and 2.0 tdyn, respectively. The rows from top to bottom refer to the Plummer, NFW1, and NFW2 halos, respectively. Satellite and host centers are pointed by a yellow circle and a cross, respectively. The halo response behind the satellite is clearly seen in the first two columns. The map for NFW2 starts to deviate from the other two models at t = 1.0, suggesting that the momentum redistribution is different. The differences between the middle and right panels, for all the models, suggest that angular momentum transfers from the satellite to the background halo.
Current usage metrics show cumulative count of Article Views (full-text article views including HTML views, PDF and ePub downloads, according to the available data) and Abstracts Views on Vision4Press platform.
Data correspond to usage on the plateform after 2015. The current usage metrics is available 48-96 hours after online publication and is updated daily on week days.
Initial download of the metrics may take a while.