Fig. 10.
Download original image
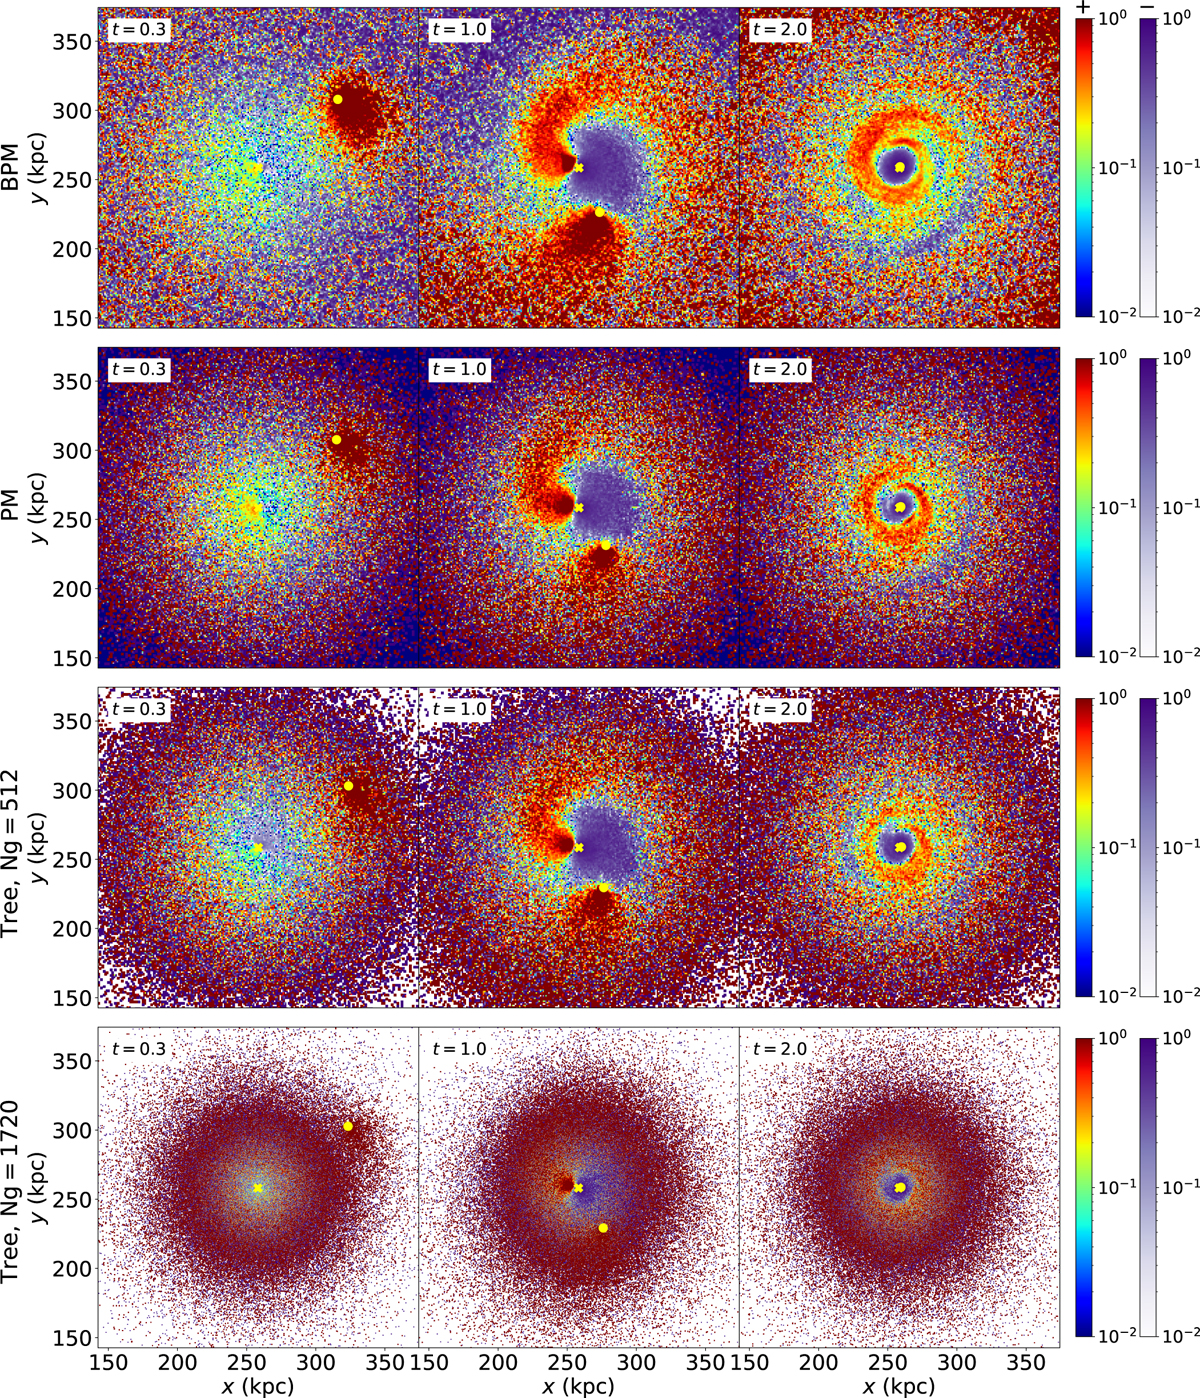
Overdensity maps noise effects with different codes and smoothing. The top row corresponds to BPM, where the overdensity is calculated directly with the solution of Continuity+Poisson equations. The second row shows the PM overdensity after applying CIC to the particle distribution. The two lowest rows correspond to the Tree code after applying CIC, using a grid resolution of 1.0 (5123 cells) and 0.3 (17203 cells) kpc, respectively. The highest resolution hardly shows the wake and global response. However, the smoothed case shows a host halo response close to the PM case, demonstrating a dependence on the grid smoothing.
Current usage metrics show cumulative count of Article Views (full-text article views including HTML views, PDF and ePub downloads, according to the available data) and Abstracts Views on Vision4Press platform.
Data correspond to usage on the plateform after 2015. The current usage metrics is available 48-96 hours after online publication and is updated daily on week days.
Initial download of the metrics may take a while.