Fig. 8.
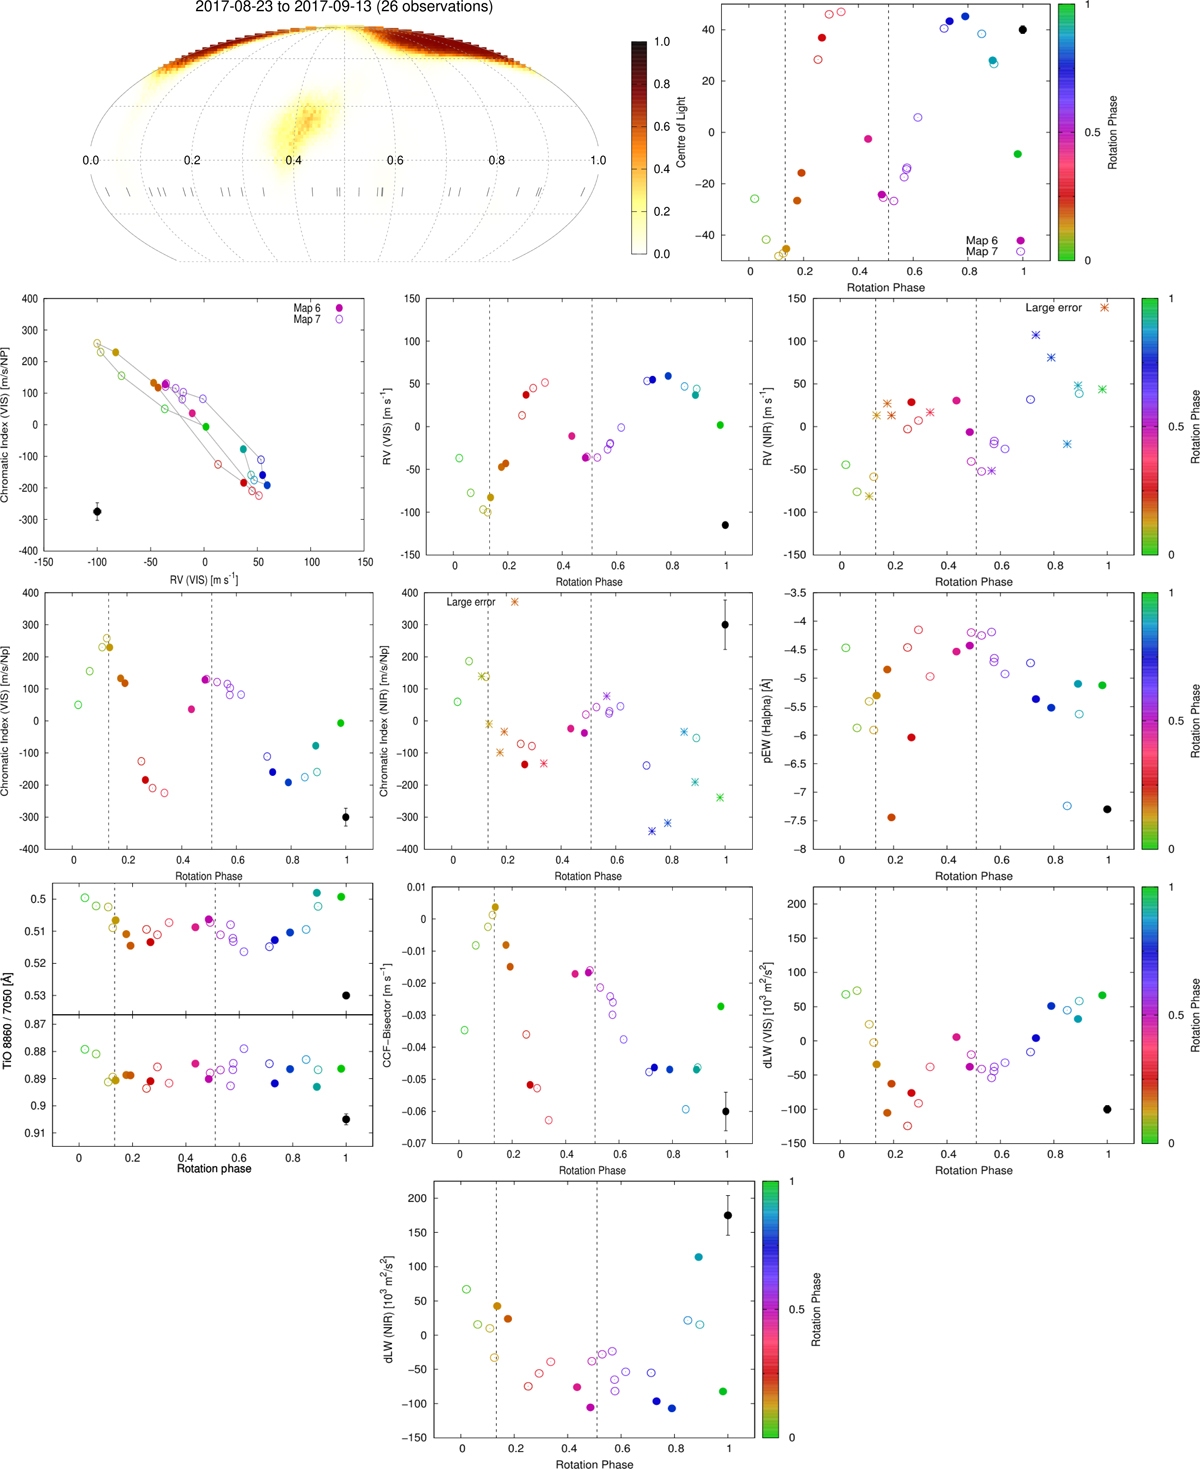
Download original image
As Fig. 7 but considering only the observational epochs used in map 9 (= combined maps 6 and 7; top row). Closed and open symbols are from maps 6 and 7 respectively. Top row: Low-resolution surface brightness map (combined) using a Mollweide projection, and the resulting centre-of-light values as a function of rotational phase. Second row: CRX as a function of RV where the rotational phases are joined by solid lines to indicate how the CRX and RV evolve as a function of phase, RV as a function of rotational phase for the VIS and NIR channels, (third row) CRX as a function of rotational phase for the VIS and NIR channels and pEW(Hα) as a function of rotation phase (fourth row) TiO 7050, 8860, CCF-Bisector and dLW (VIS) as a function of rotation phase (last row), and dLW for the NIR channel as a function of rotation phase. For the NIR data, points with error bars that are greater than the mean error shown are indicated by an asterisk. A representative error bar is shown in black for all panels.
Current usage metrics show cumulative count of Article Views (full-text article views including HTML views, PDF and ePub downloads, according to the available data) and Abstracts Views on Vision4Press platform.
Data correspond to usage on the plateform after 2015. The current usage metrics is available 48-96 hours after online publication and is updated daily on week days.
Initial download of the metrics may take a while.