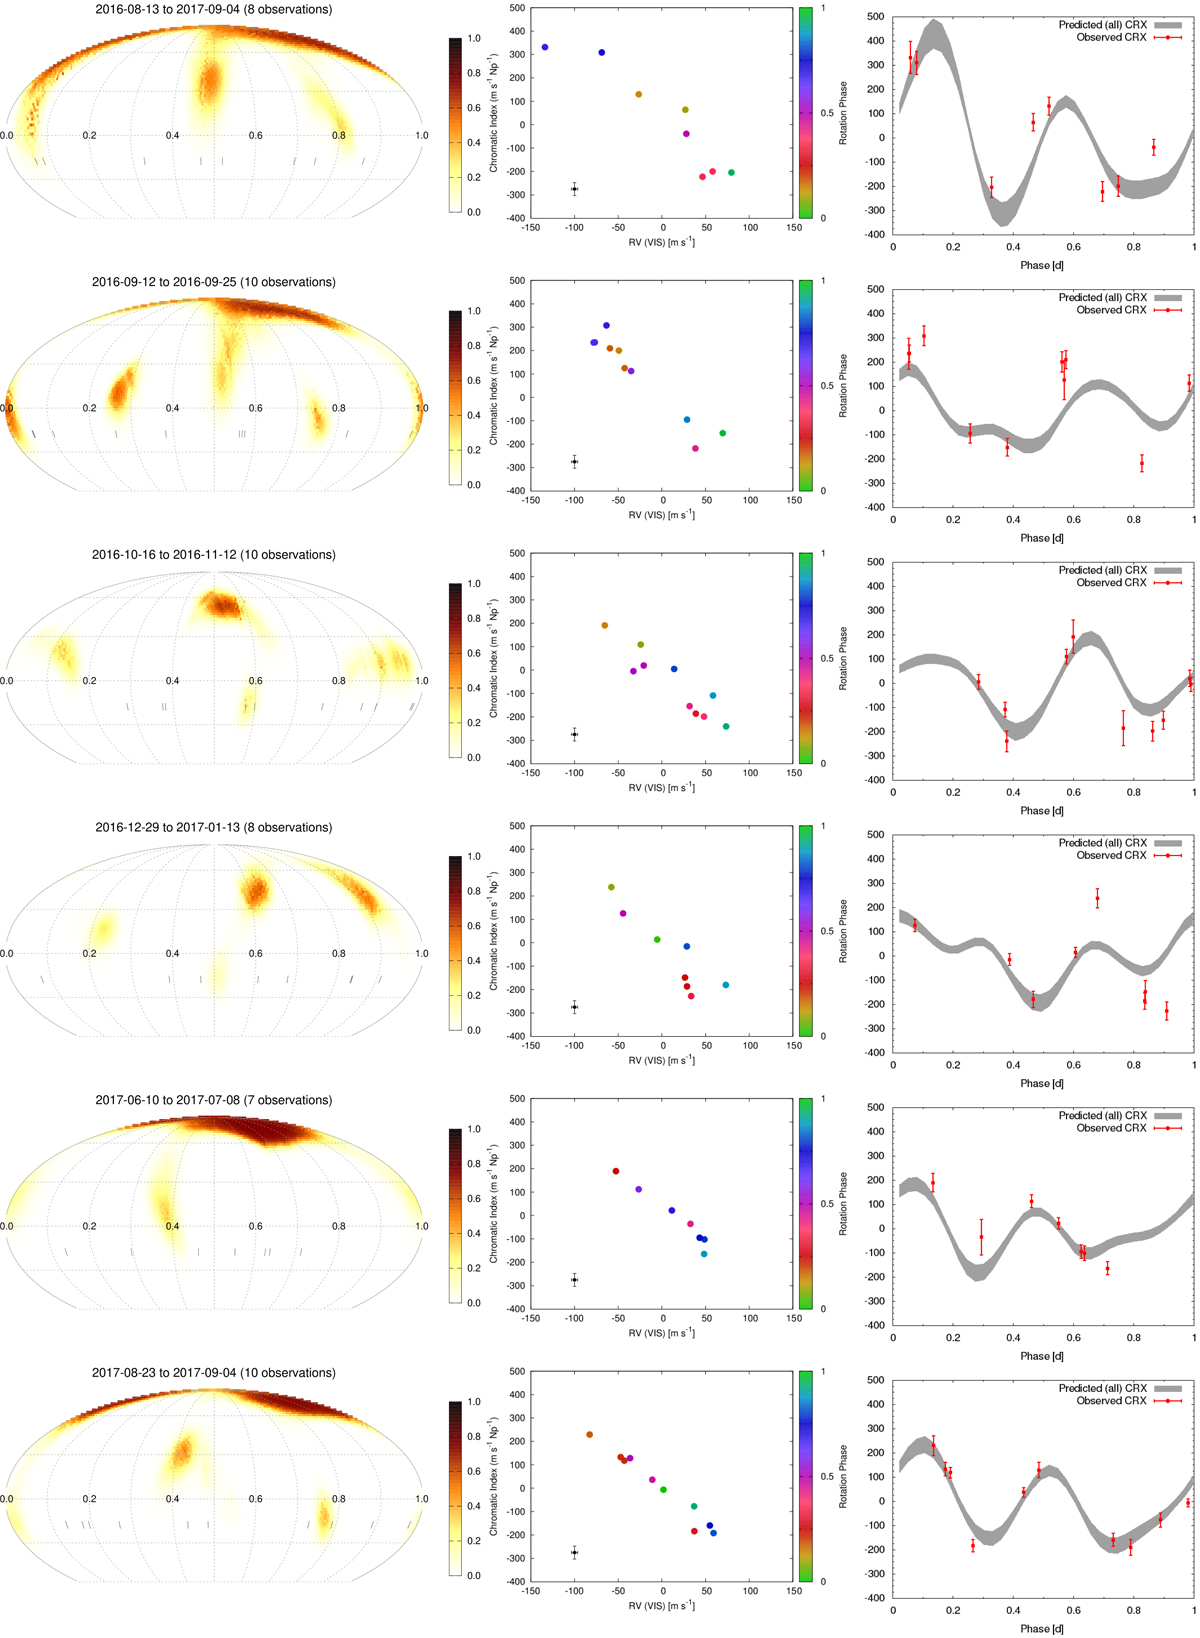
Fig. 6.
Download original image
Low-resolution Doppler images of EV Lac (left panel) with the observed CRX as a function of RV (middle panel) and the centre-of-light values (right panel), and the predicted CRX values (right panel) as a continuous distribution. The CRX vs. RV points are coloured by the rotational phase computed using the TESS rotation period. A representative error bar is shown in black.
Current usage metrics show cumulative count of Article Views (full-text article views including HTML views, PDF and ePub downloads, according to the available data) and Abstracts Views on Vision4Press platform.
Data correspond to usage on the plateform after 2015. The current usage metrics is available 48-96 hours after online publication and is updated daily on week days.
Initial download of the metrics may take a while.