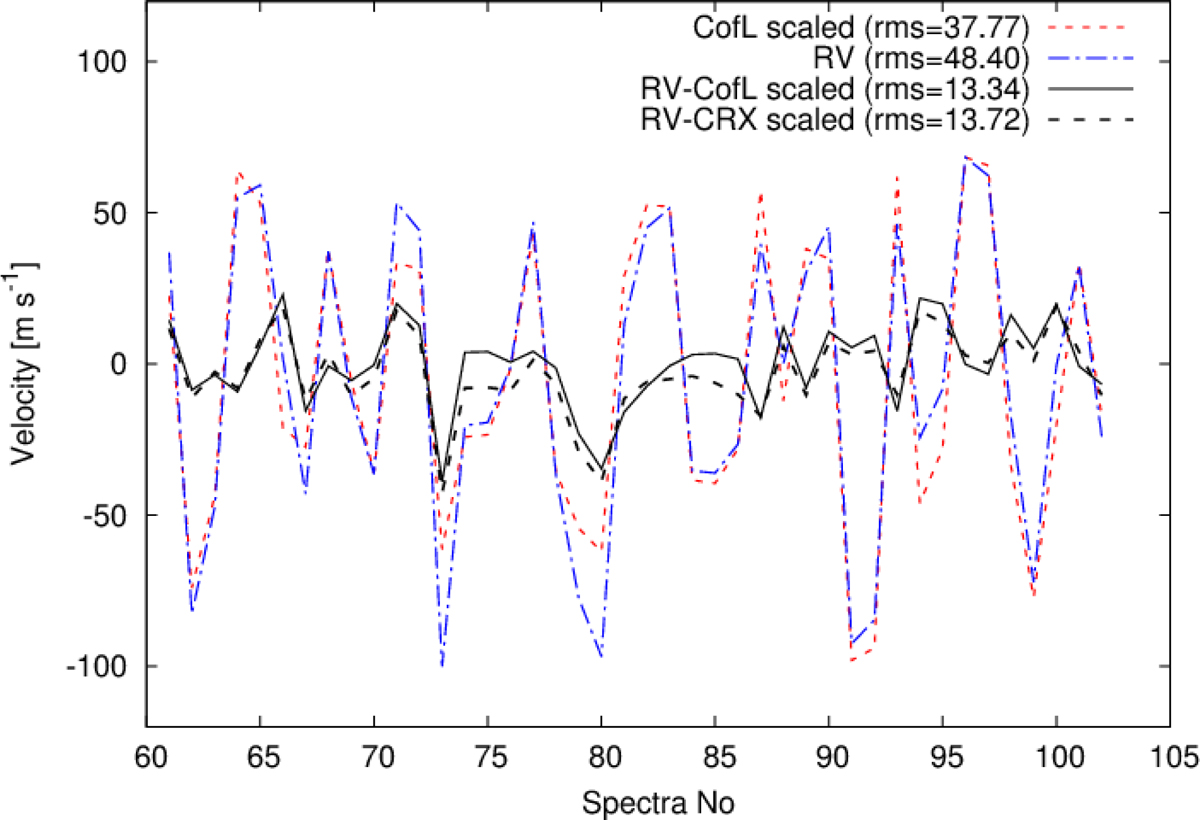
Fig. 15.
Download original image
Ability of the centre-of-light method to remove activity-induced RVs from the measured CARMENES (VIS) RVs. The dot-dashed blue line plots the RVs measured by CARMENES and processed by serval. The dashed red line shows the corresponding scaled activity-induced RVs derived using the low-resolution Doppler imaging process (centre-of-light) using Eq. (1). A linear scaling to optimise the amplitude of the model centre-of-light RVs with the observed serval RVs is applied prior to calculating the residuals shown by the solid black line. The scaling accounts the for mismatch between observed and model RVs and also for any difference in effective wavelength at which these are measured. The data points shown are for the latter three low-resolution Doppler images combined. The CRX subtracted from the RVs is shown by the dashed black line.
Current usage metrics show cumulative count of Article Views (full-text article views including HTML views, PDF and ePub downloads, according to the available data) and Abstracts Views on Vision4Press platform.
Data correspond to usage on the plateform after 2015. The current usage metrics is available 48-96 hours after online publication and is updated daily on week days.
Initial download of the metrics may take a while.