Fig. 11.
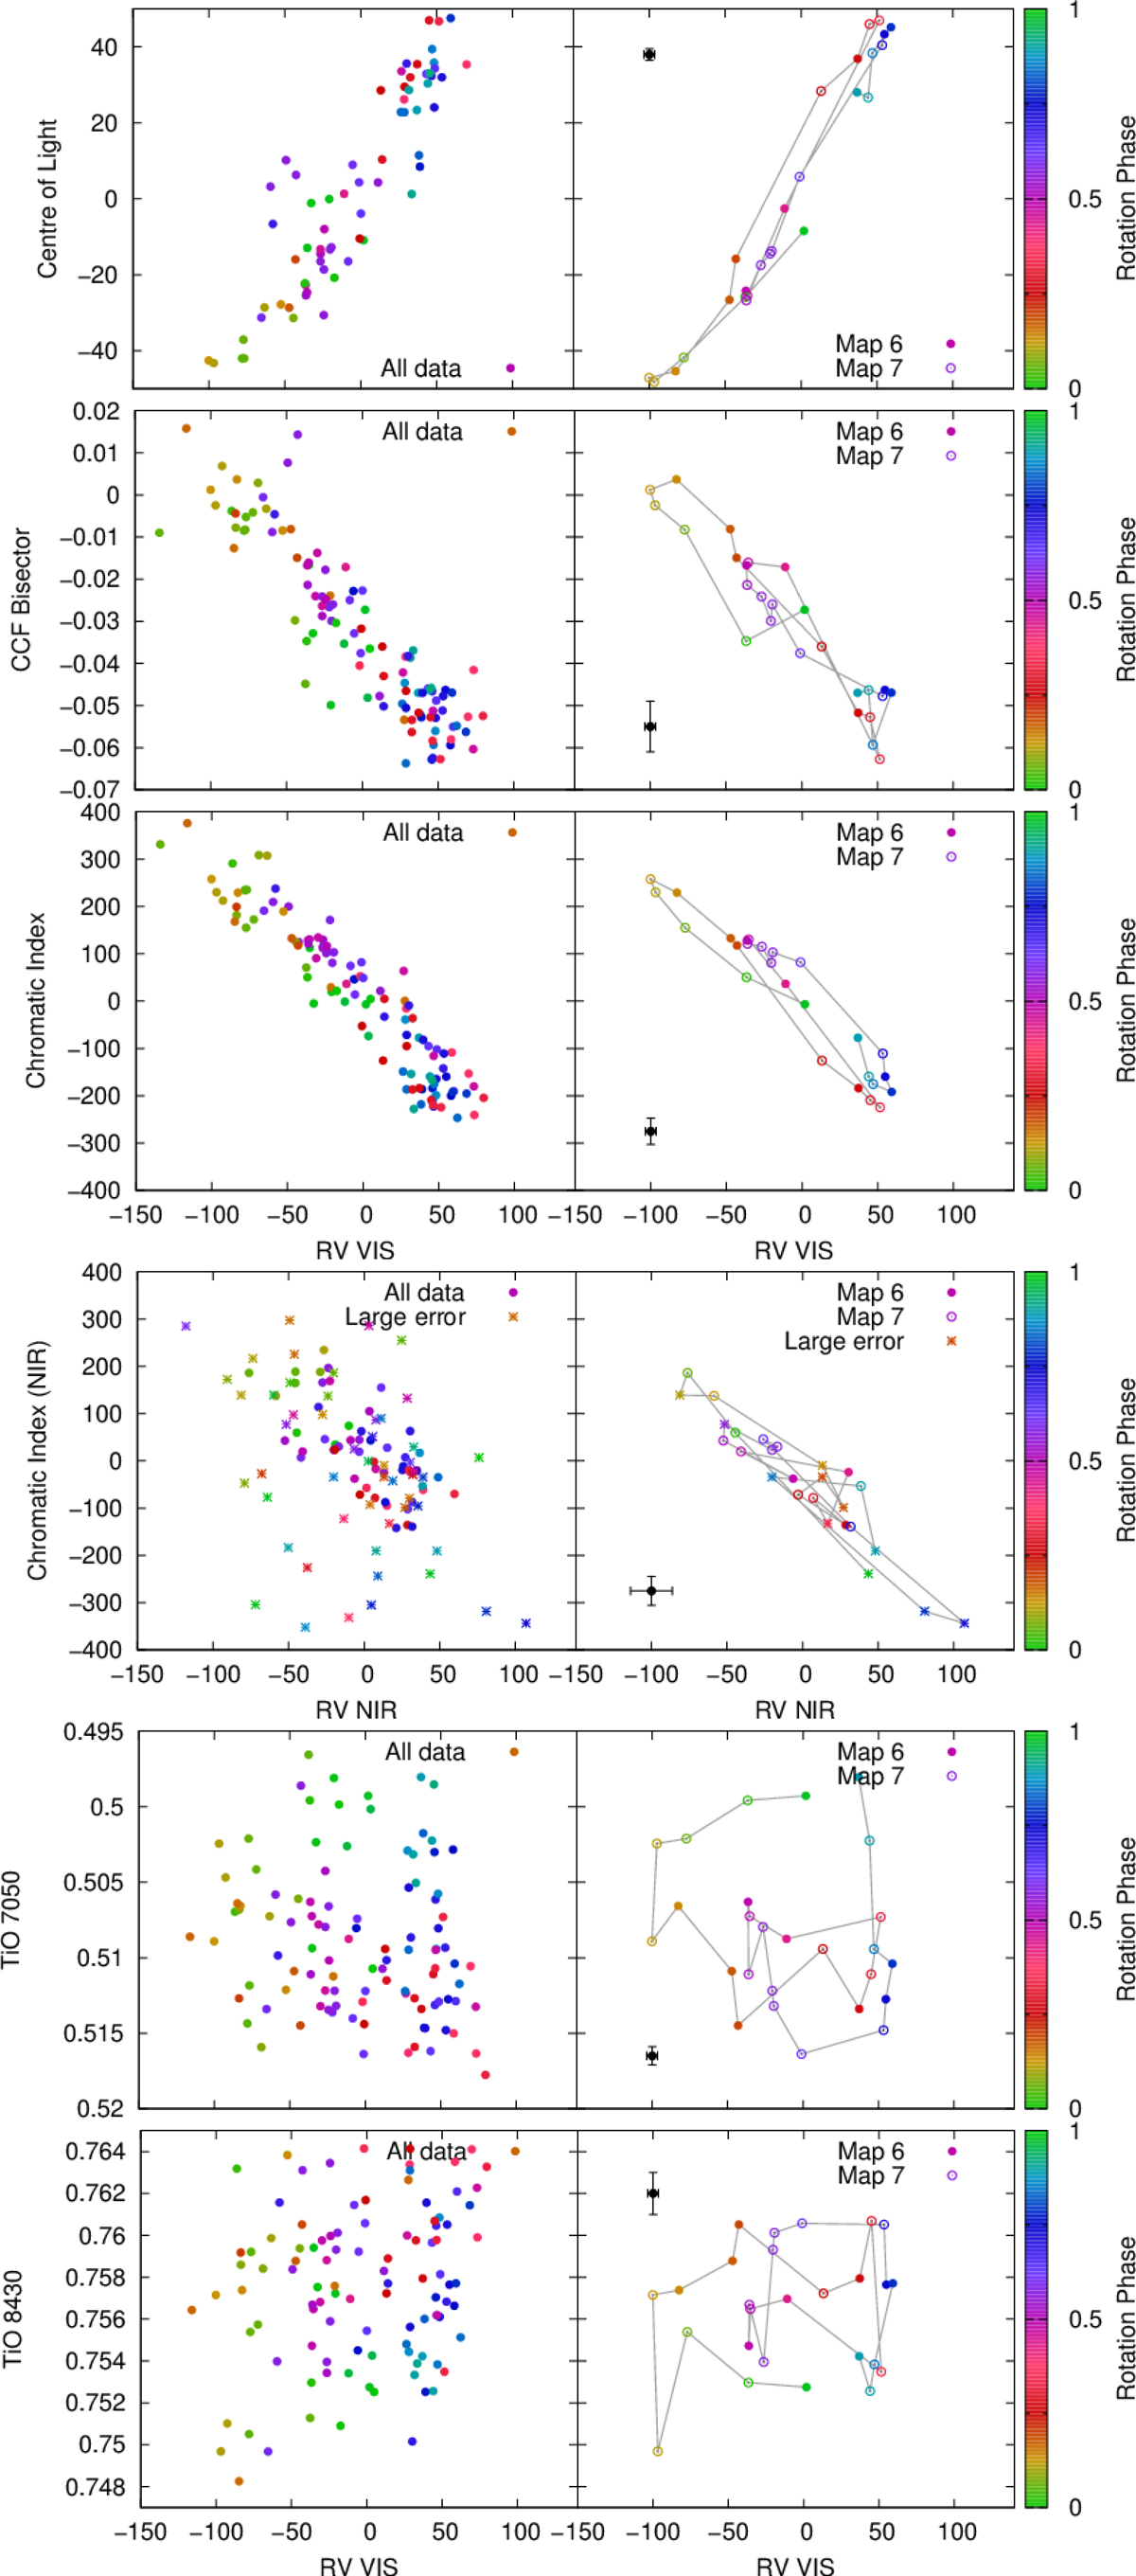
Download original image
Variation in indicators as a function of RV for the full data set (left panels) and the smaller subsample comprising map 9 (right panels). Colour indicates rotational phase. Closed circles are from map 6, and open circles are from map 7. Data points with successive rotational phases, from phases 0 to 1.0, are connected with the light grey solid line. The corresponding surface brightness image for the map 9 (combined maps 6 and 7) is shown in Fig. 6. For the NIR data, points with error bars that are greater than the mean error shown are indicated by an asterisk. A representative error bar is shown in black.
Current usage metrics show cumulative count of Article Views (full-text article views including HTML views, PDF and ePub downloads, according to the available data) and Abstracts Views on Vision4Press platform.
Data correspond to usage on the plateform after 2015. The current usage metrics is available 48-96 hours after online publication and is updated daily on week days.
Initial download of the metrics may take a while.