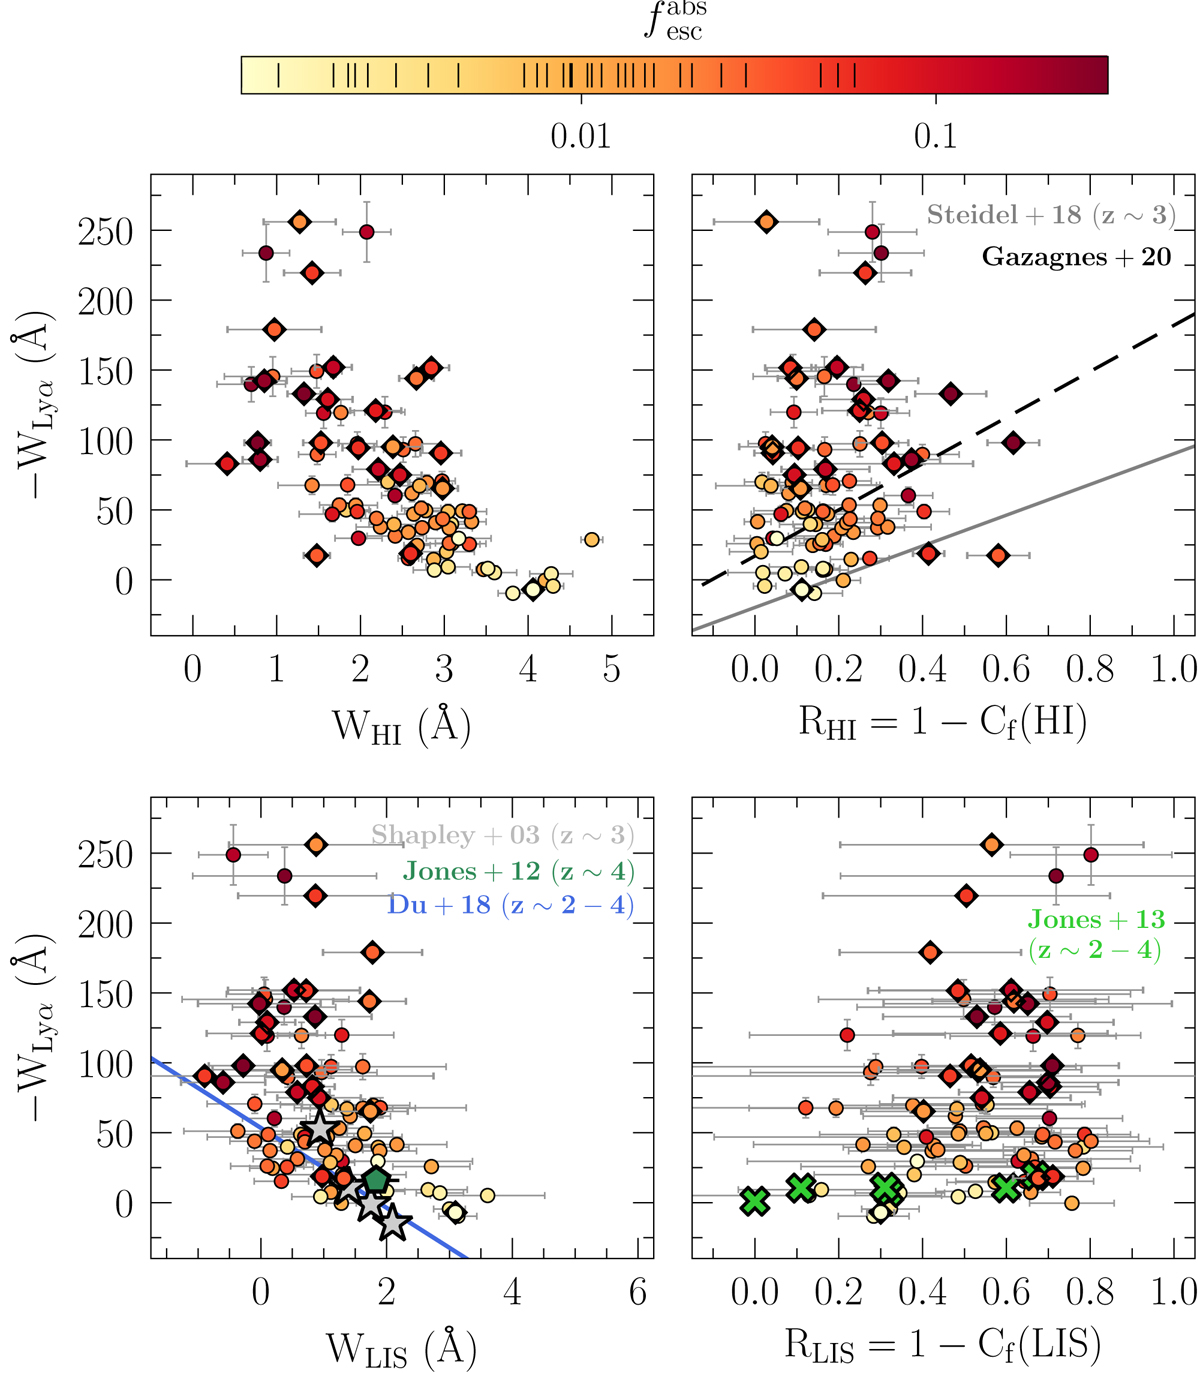
Fig. 9.
Download original image
Relation between the Lyα (WLyα), H I (top), and LIS line (bottom) equivalent widths and residual fluxes, respectively. Sources are displayed and color-coded as in Fig. 6. Solid and dashed lines represent the linear fits to the relations found in Steidel et al. (2018), Du et al. (2018), and Gazagnes et al. (2020) for comparison. Gray stars, the green polygon, and green crosses correspond to Shapley et al. (2003), Jones et al. (2012, 2013) results.
Current usage metrics show cumulative count of Article Views (full-text article views including HTML views, PDF and ePub downloads, according to the available data) and Abstracts Views on Vision4Press platform.
Data correspond to usage on the plateform after 2015. The current usage metrics is available 48-96 hours after online publication and is updated daily on week days.
Initial download of the metrics may take a while.