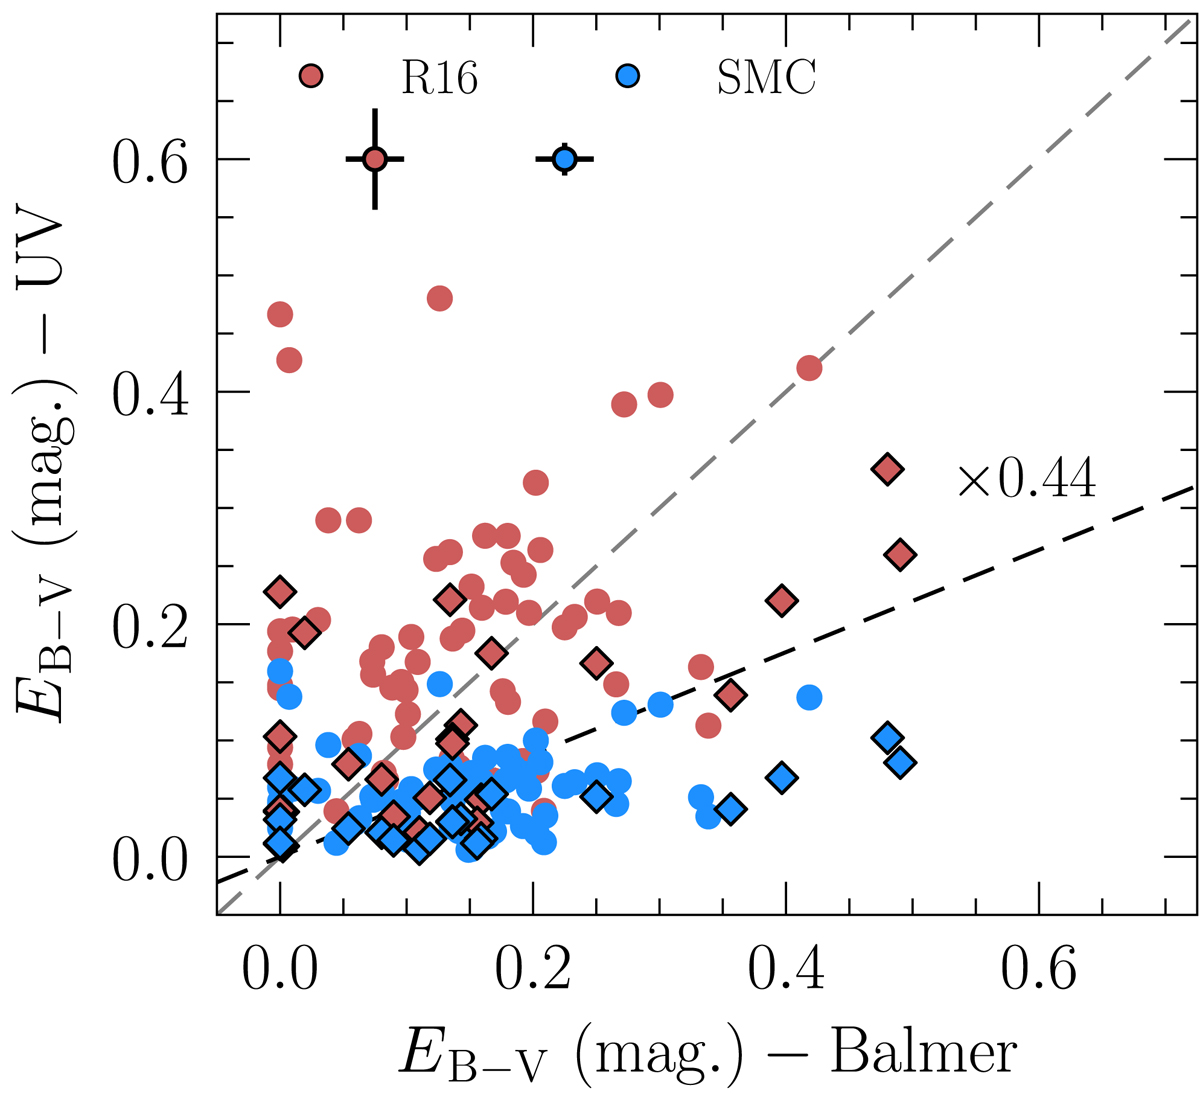
Fig. 3.
Download original image
Comparison between the optical attenuation parameter EB−V (color excess, in mag) obtained from the Balmer decrements (CCM attenuation law) and the values derived from the UV–SED fits to the COS spectra. Here we explore two different attenuation laws: R16 (red) and SMC (blue symbols). Median error bars are plotted in the upper left. Circles represent the LzLCS galaxies while diamonds are the Izotov et al. (2016a,b, 2018a,b, 2021) and Wang et al. (2019) sources. The theoretical ×0.44 shift between the stellar and nebular attenuation, which assumes a foreground screen of dust (Calzetti et al. 2000), is also shown.
Current usage metrics show cumulative count of Article Views (full-text article views including HTML views, PDF and ePub downloads, according to the available data) and Abstracts Views on Vision4Press platform.
Data correspond to usage on the plateform after 2015. The current usage metrics is available 48-96 hours after online publication and is updated daily on week days.
Initial download of the metrics may take a while.