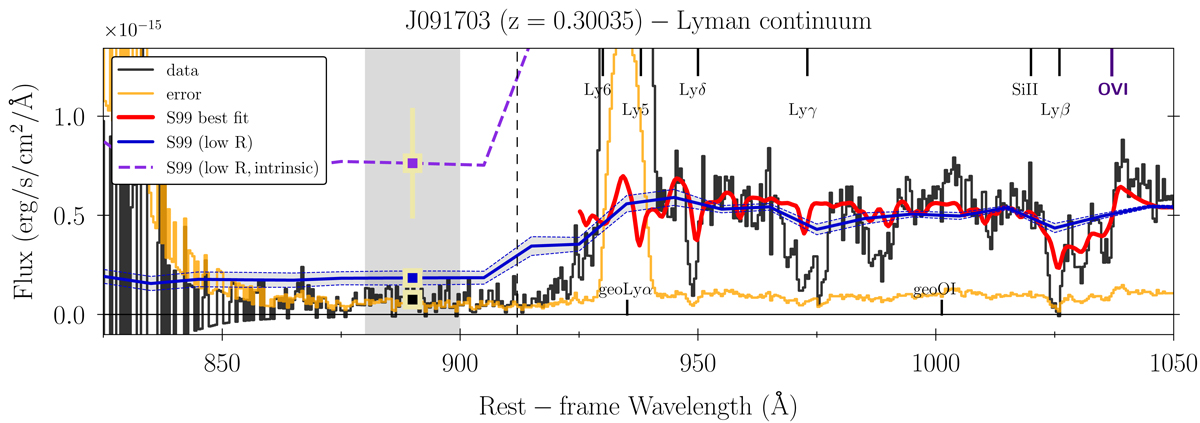
Fig. 2.
Download original image
Stellar continuum modelling in the LyC region for the J091703 galaxy. The high-resolution stellar continuum fit (down to 925 Å) and the observed J091703 flux and error are plotted in red, black, and yellow lines, respectively. The stellar continuum is now reproduced with models of lower resolution (blue line and shaded area), allowing us to go below the Lyman limit (< 912 Å, dashed vertical line). The intrinsic (unreddened) flux is shown by the purple dashed line. In the LyC window (gray-shaded), the measured, modeled, and modeled-intrinsic mean LyC fluxes are indicated with filled squares and corresponding error bars. The ISM, stellar lines, and geo-coronal lines are displayed with the same color coding as in Fig. 1.
Current usage metrics show cumulative count of Article Views (full-text article views including HTML views, PDF and ePub downloads, according to the available data) and Abstracts Views on Vision4Press platform.
Data correspond to usage on the plateform after 2015. The current usage metrics is available 48-96 hours after online publication and is updated daily on week days.
Initial download of the metrics may take a while.