Fig. E.1.
Download original image
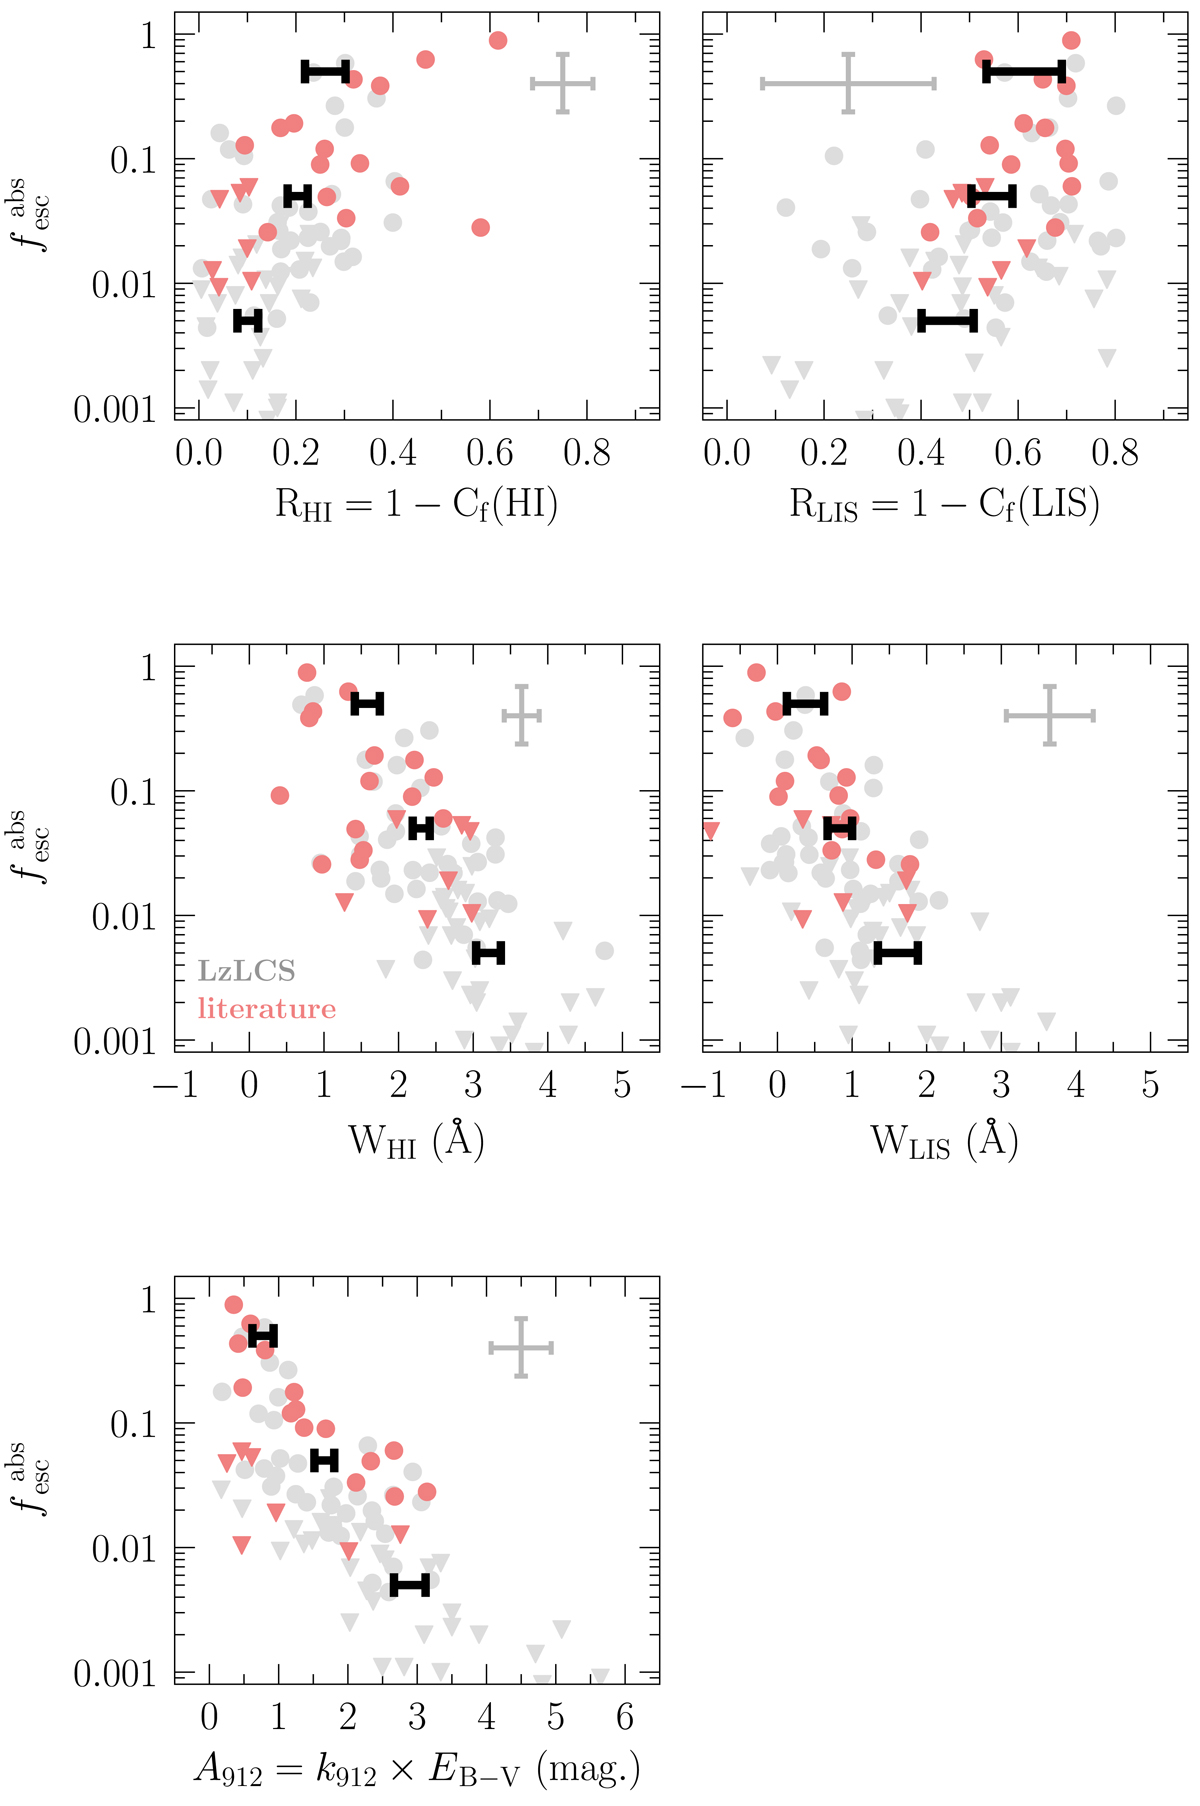
Summary plot with the correlations between the LyC absolute photon escape fraction (![]() ) and the main UV spectral properties derived in this work: R(H I), R(LIS), WH I, WLIS and EB−V (from top to bottom and left to right, respectively). Black thick error bars comprise the running median values and 0.16 and 0.84 quantiles of the parameters as a function of
) and the main UV spectral properties derived in this work: R(H I), R(LIS), WH I, WLIS and EB−V (from top to bottom and left to right, respectively). Black thick error bars comprise the running median values and 0.16 and 0.84 quantiles of the parameters as a function of ![]() . The individual measurements are shown in the background through gray (LzLCS) and red (literature) symbols. Error bars at the top of the panels represent the median 1σ uncertainty of each parameter, based on individual errors.
. The individual measurements are shown in the background through gray (LzLCS) and red (literature) symbols. Error bars at the top of the panels represent the median 1σ uncertainty of each parameter, based on individual errors.
Current usage metrics show cumulative count of Article Views (full-text article views including HTML views, PDF and ePub downloads, according to the available data) and Abstracts Views on Vision4Press platform.
Data correspond to usage on the plateform after 2015. The current usage metrics is available 48-96 hours after online publication and is updated daily on week days.
Initial download of the metrics may take a while.