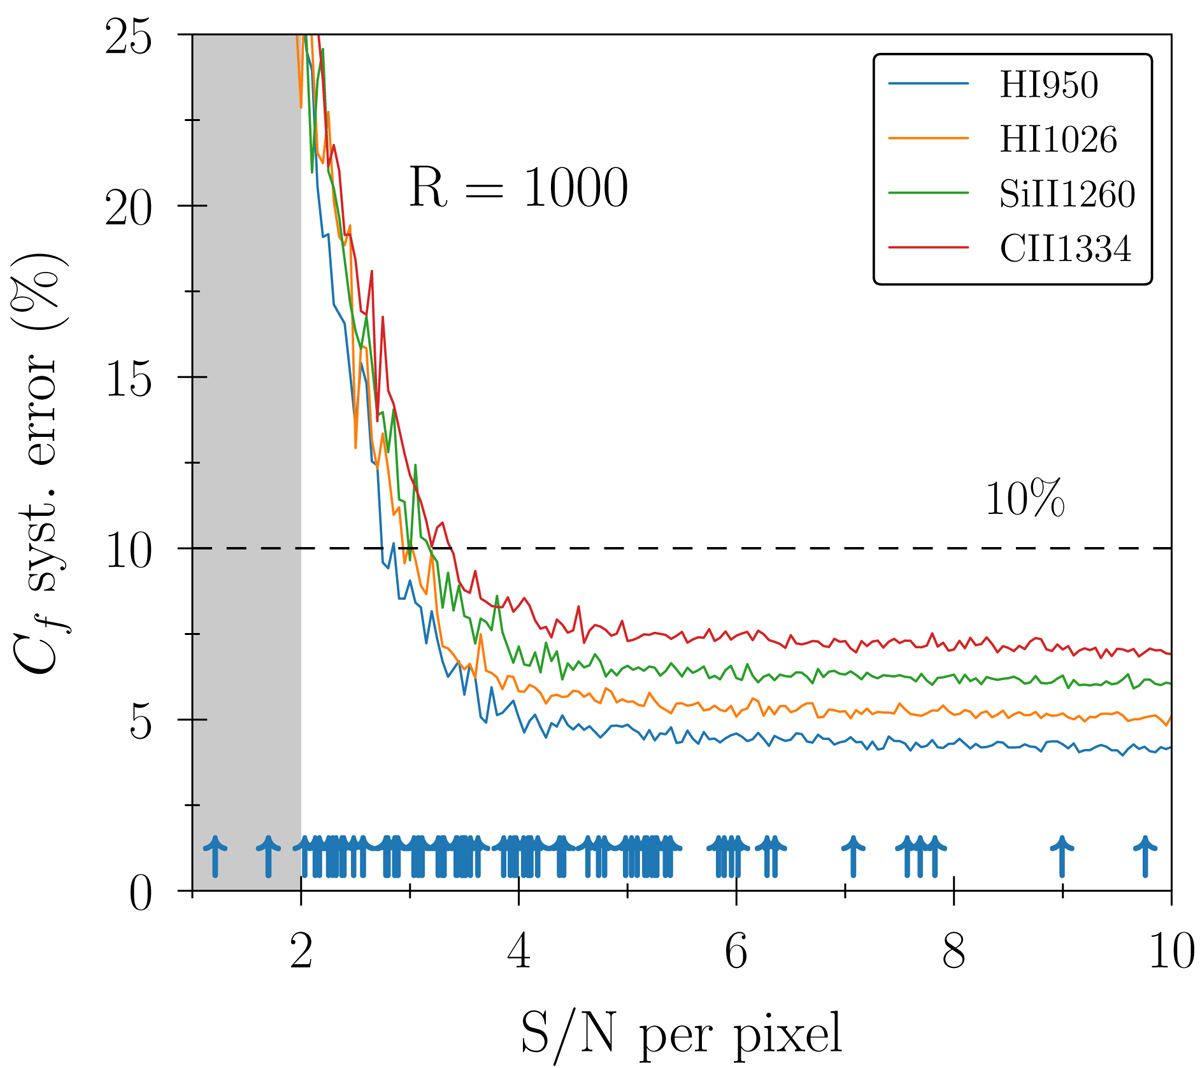
Fig. C.1.
Download original image
Estimation of the systematic error on the observed covering fraction as a function of the spectral S/N per pixel, for different simulated lines (see legend). A resolution of R = 1000 is assumed. The upward arrows at the bottom correspond to the measured S/N for the LzLCS sample around the H Iλ950 line. Horizontal dashed line limits the 10% representative value.
Current usage metrics show cumulative count of Article Views (full-text article views including HTML views, PDF and ePub downloads, according to the available data) and Abstracts Views on Vision4Press platform.
Data correspond to usage on the plateform after 2015. The current usage metrics is available 48-96 hours after online publication and is updated daily on week days.
Initial download of the metrics may take a while.