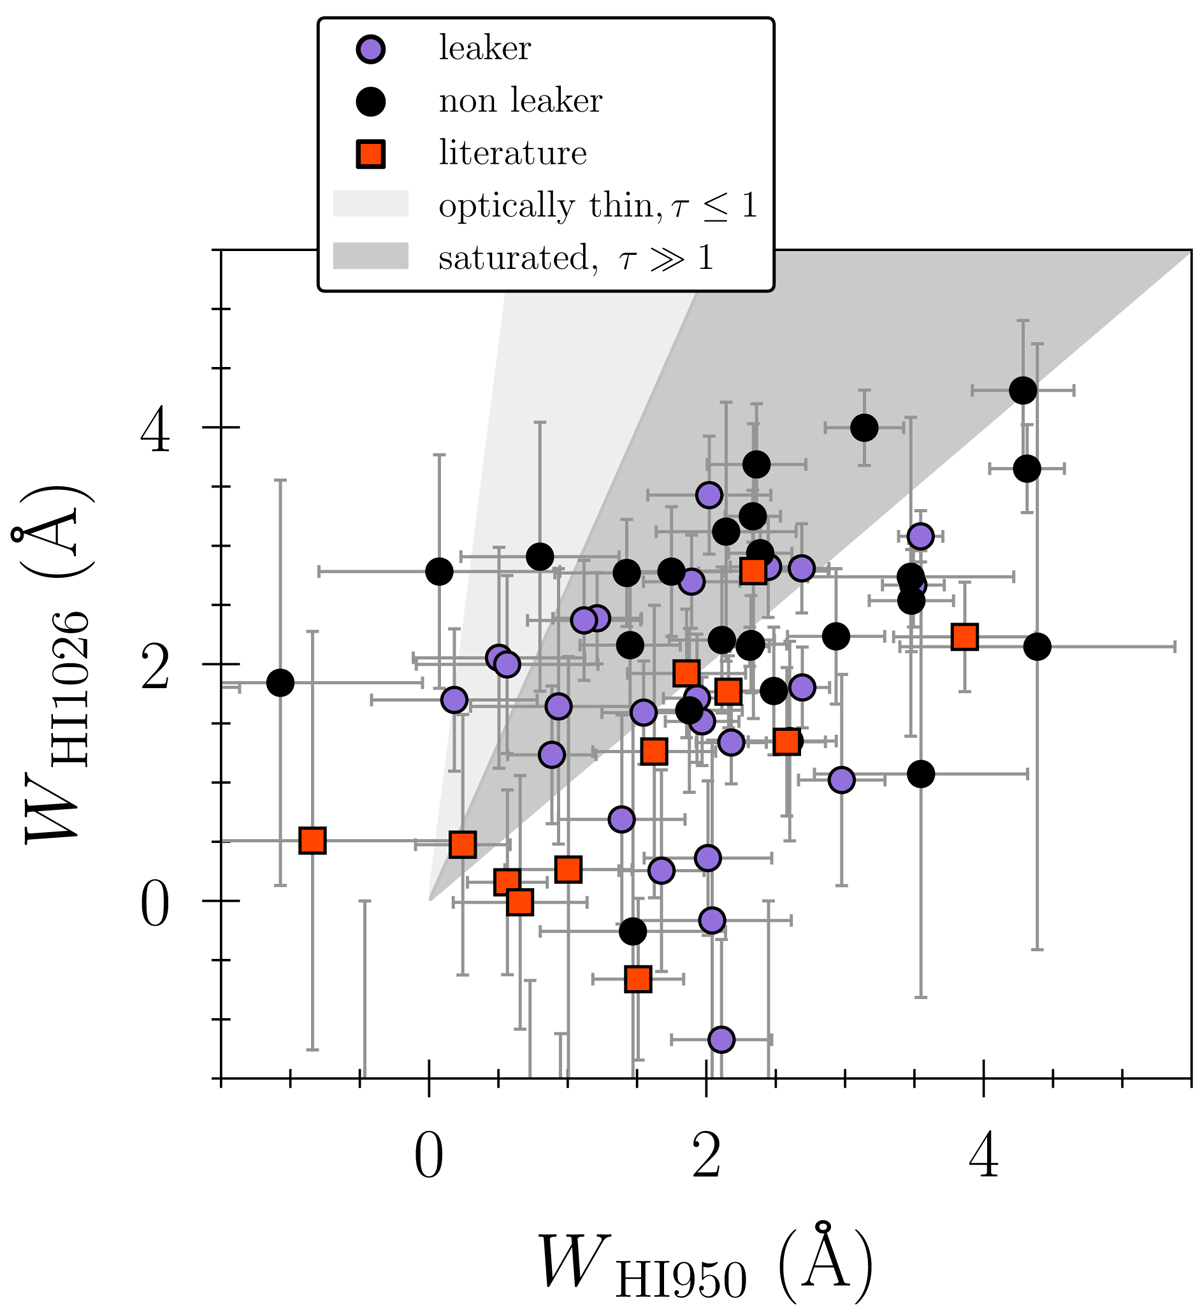
Fig. B.1.
Download original image
Absorption line H I equivalent width comparisons for studying the condition of saturation. The optically thin (light-gray) and optically thick (dark-gray) regions are delimited using the approximations given in Draine (2011). As in the entire document, purple symbols represent the leakers while the black symbols show the nonleakers. Red squares correspond to the Izotov et al. (2016a,b, 2018a,b, 2021) and Wang et al. (2019) galaxies.
Current usage metrics show cumulative count of Article Views (full-text article views including HTML views, PDF and ePub downloads, according to the available data) and Abstracts Views on Vision4Press platform.
Data correspond to usage on the plateform after 2015. The current usage metrics is available 48-96 hours after online publication and is updated daily on week days.
Initial download of the metrics may take a while.