Fig. 16.
Download original image
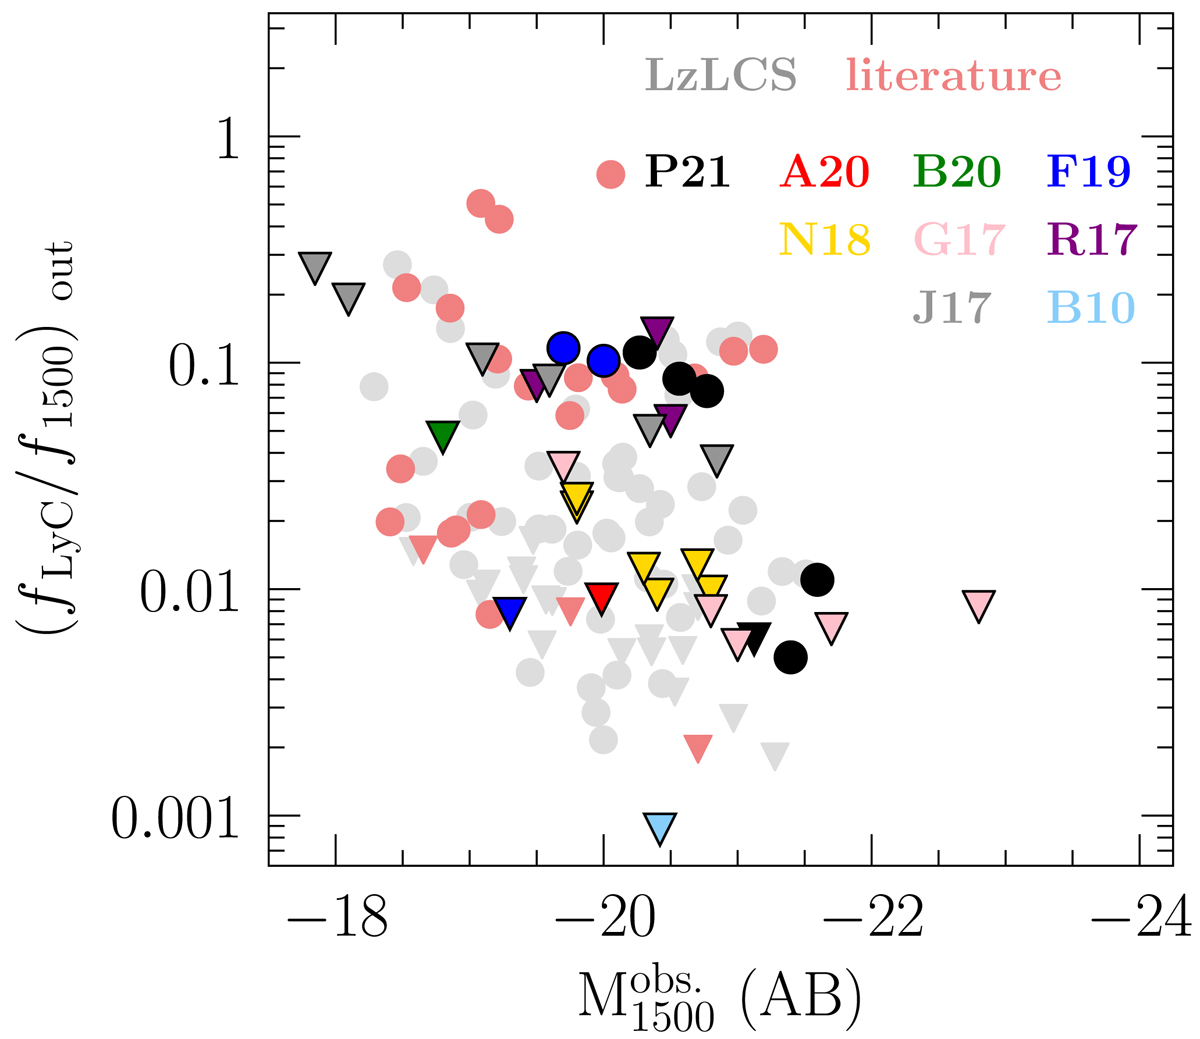
Ionizing-to-nonionizing observed flux ratio (f LyC/f1500) out in units of Fν as a function of ![]() for high- and low-z galaxies. At high redshift, we only show measurements determined from stacks. LyC detections from Pahl et al. (2021) and Fletcher et al. (2019) at z ∼ 3 are plotted in black and blue symbols. Circles show detections and downward pointing triangles are 1σ upper limits that are color coded by sample (Pahl et al. 2021; Alavi et al. 2020; Bian & Fan 2020; Fletcher et al. 2019; Naidu et al. 2018; Grazian et al. 2017; Rutkowski et al. 2017; Japelj et al. 2017). The high-z data probe z ∼ 2.5 − 4, except for the study of Alavi et al. (2020) at z ∼ 1.3, and Bridge et al. (2010) at z ∼ 0.7. The low-z data from the present study (LzLCS and literature) are plotted in light gray and red, as in the previous figure.
for high- and low-z galaxies. At high redshift, we only show measurements determined from stacks. LyC detections from Pahl et al. (2021) and Fletcher et al. (2019) at z ∼ 3 are plotted in black and blue symbols. Circles show detections and downward pointing triangles are 1σ upper limits that are color coded by sample (Pahl et al. 2021; Alavi et al. 2020; Bian & Fan 2020; Fletcher et al. 2019; Naidu et al. 2018; Grazian et al. 2017; Rutkowski et al. 2017; Japelj et al. 2017). The high-z data probe z ∼ 2.5 − 4, except for the study of Alavi et al. (2020) at z ∼ 1.3, and Bridge et al. (2010) at z ∼ 0.7. The low-z data from the present study (LzLCS and literature) are plotted in light gray and red, as in the previous figure.
Current usage metrics show cumulative count of Article Views (full-text article views including HTML views, PDF and ePub downloads, according to the available data) and Abstracts Views on Vision4Press platform.
Data correspond to usage on the plateform after 2015. The current usage metrics is available 48-96 hours after online publication and is updated daily on week days.
Initial download of the metrics may take a while.