Fig. 15.
Download original image
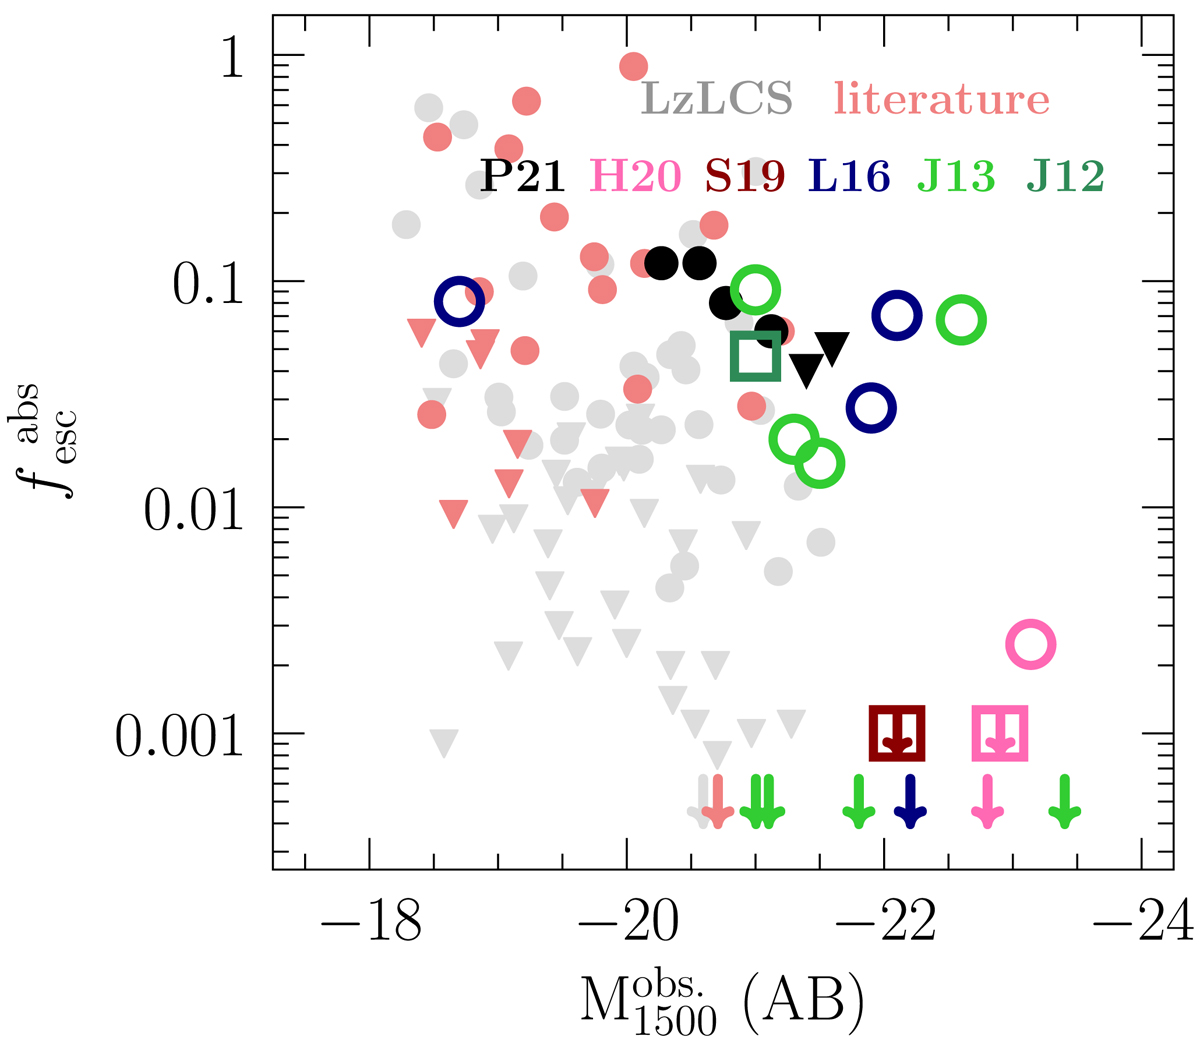
Estimated and measured LyC absolute escape fractions of high- and low-z galaxies as a function of the observed ![]() . Open circles and squares show the
. Open circles and squares show the ![]() predictions from the UV LIS lines for individual galaxies and stacks, respectively, taken from Harikane et al. (2020) at z ∼ 6, in pink; Sugahara et al. (2019) at z ∼ 5, in dark red; Leethochawalit et al. (2016) at z ∼ 4 − 5, in blue; Jones et al. (2013) at z ∼ 2 − 4, in light green; and Jones et al. (2012) at z ∼ 4, in green. Direct
predictions from the UV LIS lines for individual galaxies and stacks, respectively, taken from Harikane et al. (2020) at z ∼ 6, in pink; Sugahara et al. (2019) at z ∼ 5, in dark red; Leethochawalit et al. (2016) at z ∼ 4 − 5, in blue; Jones et al. (2013) at z ∼ 2 − 4, in light green; and Jones et al. (2012) at z ∼ 4, in green. Direct ![]() measurements from this paper (LzLCS and literature) are plotted in light gray and red; z ∼ 3 measurements from Pahl et al. (2021) measurements are displayed with filled black symbols, for comparison. Downward-pointing arrows represent sources with estimated
measurements from this paper (LzLCS and literature) are plotted in light gray and red; z ∼ 3 measurements from Pahl et al. (2021) measurements are displayed with filled black symbols, for comparison. Downward-pointing arrows represent sources with estimated ![]() ≈ 0.
≈ 0.
Current usage metrics show cumulative count of Article Views (full-text article views including HTML views, PDF and ePub downloads, according to the available data) and Abstracts Views on Vision4Press platform.
Data correspond to usage on the plateform after 2015. The current usage metrics is available 48-96 hours after online publication and is updated daily on week days.
Initial download of the metrics may take a while.