Fig. 13.
Download original image
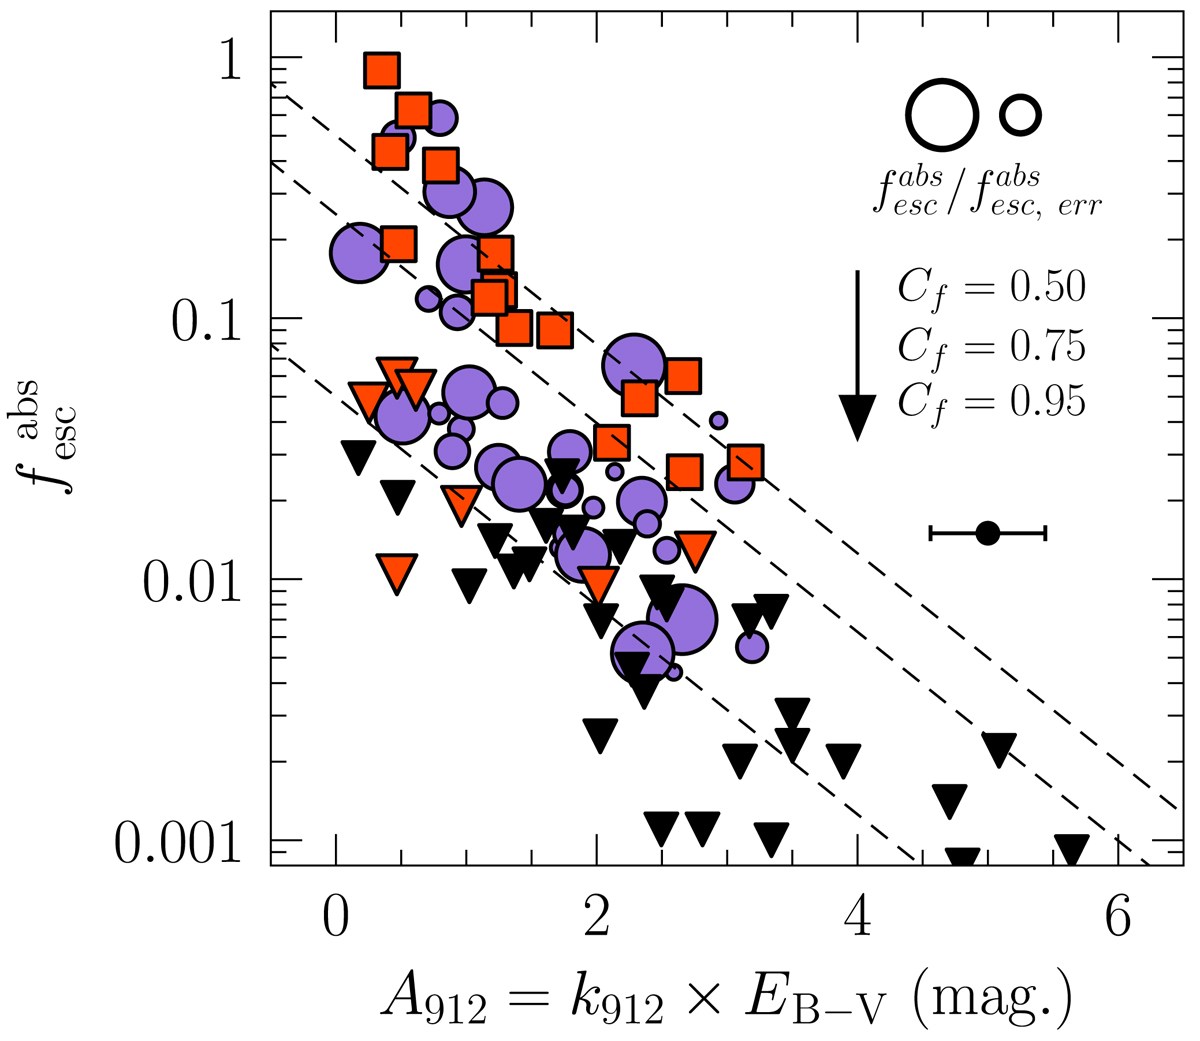
Correlation between the LyC absolute photon escape fraction (![]() ) and the UV dust-attenuation: A912 = k912 × EB-V. Labeling is as in Fig. 11. The median 1σ uncertainty on AUV is plotted on the right of the plot. Overplotted are the three lines predicted by Eq. (6) for Cf(H I) = 0.5,0.75, and 0.95, respectively (dashed lines), using k912 = 12.87 (R16 law).
) and the UV dust-attenuation: A912 = k912 × EB-V. Labeling is as in Fig. 11. The median 1σ uncertainty on AUV is plotted on the right of the plot. Overplotted are the three lines predicted by Eq. (6) for Cf(H I) = 0.5,0.75, and 0.95, respectively (dashed lines), using k912 = 12.87 (R16 law).
Current usage metrics show cumulative count of Article Views (full-text article views including HTML views, PDF and ePub downloads, according to the available data) and Abstracts Views on Vision4Press platform.
Data correspond to usage on the plateform after 2015. The current usage metrics is available 48-96 hours after online publication and is updated daily on week days.
Initial download of the metrics may take a while.