Fig. 12.
Download original image
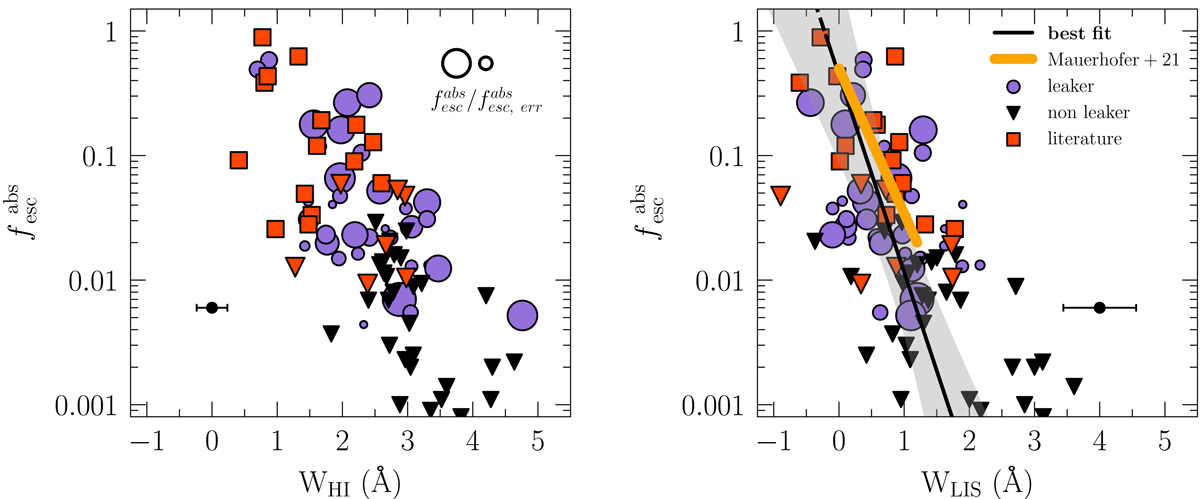
The correlation between the LyC absolute photon escape fraction (![]() ) and the H I (left) and LIS lines (right) equivalent widths. The sizes and colors of the points have the same meaning as in Fig. 11. The median 1σ uncertainty on the equivalent width is placed at the bottom of every panel. The black solid line in the right panel corresponds to the best linear fit (Eq. (11)), and the gray-shaded area represents the 2σ confidence interval, including intrinsic scatter. The upper limit prediction from Mauerhofer et al. (2021) using the C IIλ1334 line is plotted in orange.
) and the H I (left) and LIS lines (right) equivalent widths. The sizes and colors of the points have the same meaning as in Fig. 11. The median 1σ uncertainty on the equivalent width is placed at the bottom of every panel. The black solid line in the right panel corresponds to the best linear fit (Eq. (11)), and the gray-shaded area represents the 2σ confidence interval, including intrinsic scatter. The upper limit prediction from Mauerhofer et al. (2021) using the C IIλ1334 line is plotted in orange.
Current usage metrics show cumulative count of Article Views (full-text article views including HTML views, PDF and ePub downloads, according to the available data) and Abstracts Views on Vision4Press platform.
Data correspond to usage on the plateform after 2015. The current usage metrics is available 48-96 hours after online publication and is updated daily on week days.
Initial download of the metrics may take a while.